AC CFD Technical Analysis and Acceleration/Deceleration CFD Signals
Created by Bill Williams
Acceleration/Deceleration measures acceleration and deceleration of the cfd trend momentum - it is popularly used to analyze both stock markets and cfds market movements.
This cfd indicator changes direction before the cfds price changes its direction.
The Acceleration/Deceleration is used to generate early signals of cfd trend reversals.
If AC changes direction then cfds price direction will soon follow.
CFDs Technical Analysis and Generating CFDs Signals
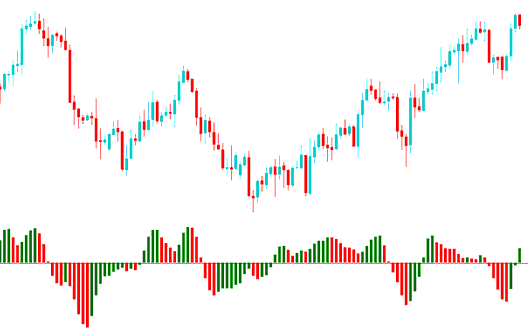
The Zero-line is the spot where the momentum is at balance with acceleration or deceleration.
If Acceleration/Deceleration is higher than Zero, then it is easier for the acceleration to continue in the upward movement.
If Acceleration/Deceleration is lower than Zero, then it is easier for the deceleration to continue in the downwards movement.
The Zero point is not regarded as a buy or sell cfd signal when it is crossed.
A buy or sell cfd trade is generated when the color of the AC changes from red to green.
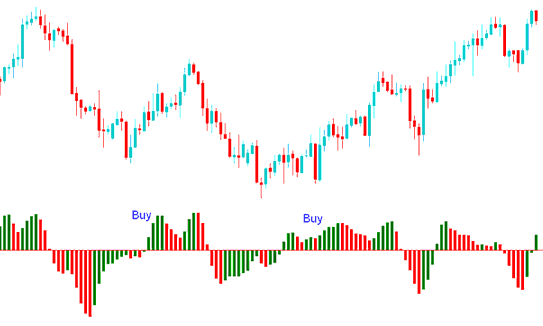
Buy CFDs Signal
When the current column changes from red to green this is analyzed as a buy.
When the current column is colored red, you can't buy.
When the indicator is higher than Zero & the current bar is green a buy cfds trade signal is generated.
When the AC is lower than zero and the current bar is green a confirmation signal is required for a buy. Three green bars is usually another confirmation.
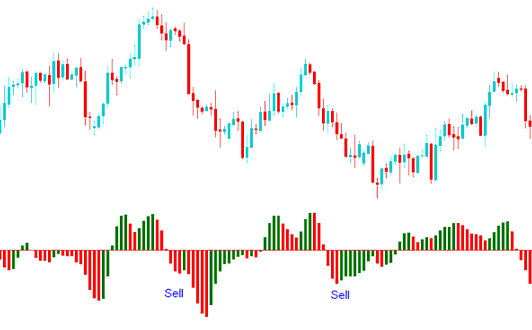
Sell CFDs Signal
When the current column changes from green to red this is interpreted as a sell.
When the current column is colored green, you can't sell.
When the indicator is lower than Zero and the current bar is red is a sell cfds trade signal is generated.
When the AC is higher than zero & the current bar is red a confirmation signal is required for a sell. Three green bars is usually another confirmation.
Technical Analysis in CFDs Trading