William Percent R CFD Technical Analysis & William Percent R CFD Signals
Williams %R Technical CFD Technical Indicator Developed by Larry William
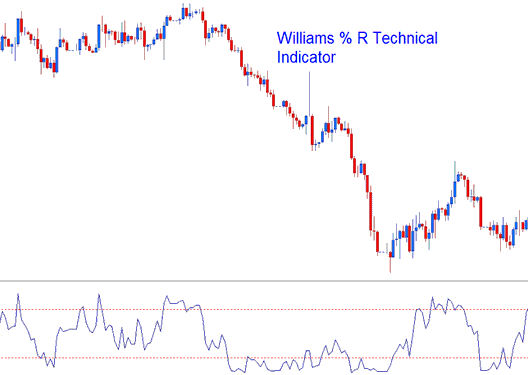
Williams %R indicator is pronounced as Williams percent R indicator. Williams %R Technical CFDs Technical Indicator is a momentum oscillator used to analyze overbought and oversold levels in the cfds markets.
The William % Range oscillator is similar to the Stochastic Oscillator indicator, apart from that fact that the %R is drawn upside down on a negative scale that's from 0 to -100 & the indicator doesn't apply a smoothing factor.
Williams Percent R, Percent R Technical CFDs Indicator - CFD Indicators
The Williams %R indicator analyzes the association of the closing cfd prices relative to the High and Low range over a selected number of n candlesticks.
- The closer the closing cfds price of a candlestick is to the highest high of the range selected the closer to zero the %R reading will be.
- The closer the closing cfds price of a candlestick is to the lowest low of the range selected the closer to -100 the %R reading will be.
When doing technical analysis a trader should ignore the minus sign placed before the value, for examples -40, the - sign should be ignored, just remember the indictor values are placed in an upside down manner.
- At zero: If the closing cfds price of the candlestick is equal to the highest high of the range the William %R reading will be 0.
- At -100: if the closing cfds price of the candlestick is equal to the lowest low of the range the William %R reading will be -100.
William Percent R Technical Indicator
Oversold/Overbought Levels on Indicator
- Overbought- William %R values from 0 to -20 are considered overbought while
- Oversold- William %R values from -80 to -100 are considered oversold.
As for trading overbought/oversold levels it is best to wait for a cfd to change direction before taking a signal in the opposite direction. For Example if a cfd is oversold it is best to wait for the cfd trend to reverse and start to head in an upward direction before buying the cfd.
CFD Trend Reversal CFD Signals
The William %R indicator used to predict a cfd trend reversal cfd signal when trading a cfd. Williams %R indicator always predict a reversal using the following technique
Bearish Reversal CFD Signal- William Percent Range indicator forms a peak and turns down a few days before the cfds price cfd trend peaks and turns down. The example shown below shows %R giving a reversal cfd signal before cfds price starts to head down and change to a down cfds trend.
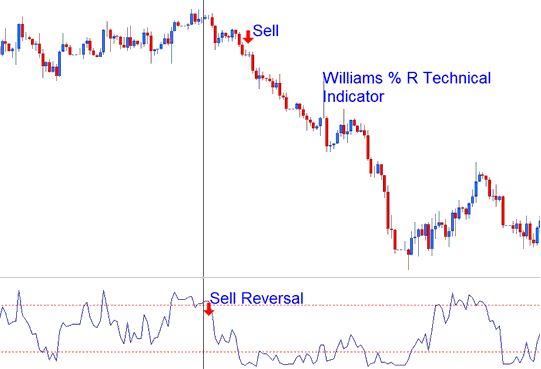
Bearish Reversal CFD Signal after CFD Trading Uptrend
Bullish Reversal CFD Signal- William Percent Range indicator forms a trough and turns up a few days before the cfds price cfd trend bottoms and turns up.
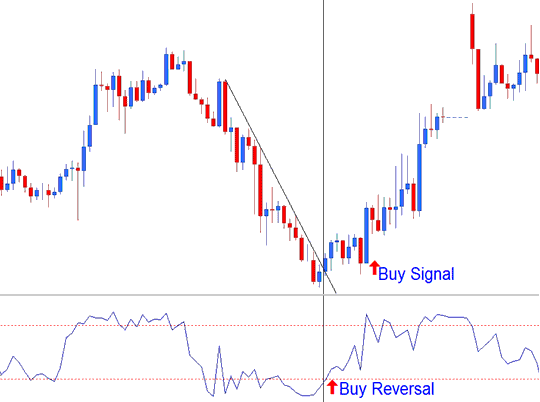
Bullish Reversal CFD Signal after CFD Trading Downtrend