Bulls Power CFD Technical Analysis and Bulls Power CFD Signals
Created by Alexander Elder
Bulls Power is used to estimate power of the Bulls (Buyers). Bulls Power estimates the balance of power between the bulls and bears.
This cfd indicator aims at identifying if a bullish cfd trend will continue or if the cfds price has reached a point where it might reverse.
Calculation
A CFD Price bar has 4 parameters: the Opening, Closing, High and Low of the cfds price bar.
Each CFD Price bar either closes higher or lower than the previous cfds price bar.
The highest cfds price will indicate the maximum power of the Bulls within a cfds price period.
The lowest cfds price will indicate the maximum power of the Bears within a cfds price period.
This Indicator uses the High of the cfds price and a Moving Average (Exponential)
The moving Average represents the middle ground between sellers and buyers for a certain cfds price period.
Therefore:
Bulls Power = High CFD Price - Exponential Moving Average
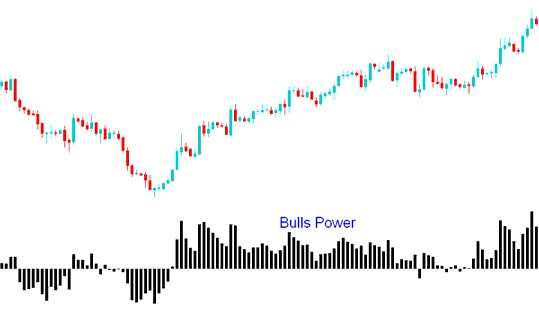
Bulls Power
CFDs Technical Analysis & How to Generate CFDs Signals
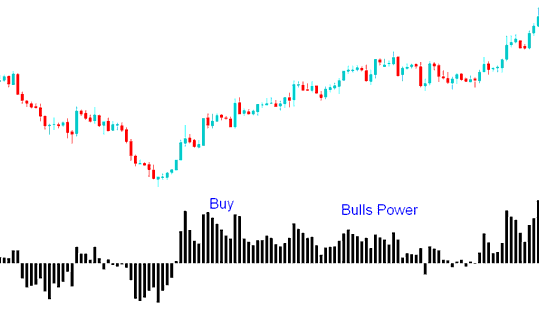
Buy CFDs Signal
A buy cfd signal is generated when the Bulls Power oscillator moves above Zero.
In an up cfd trend, the HIGH is higher than EMA, so the Bulls Power is above zero and Histogram/Oscillator is located above zero line.
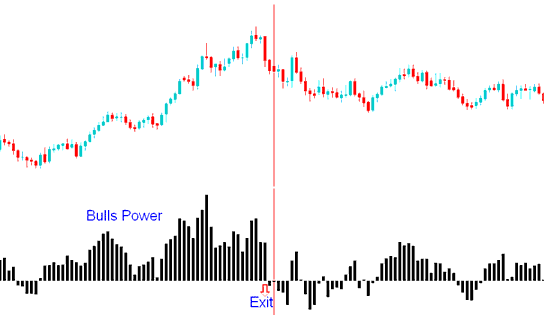
Exit Trading Signal
If the HIGH falls under EMA then it means that cfds price are starting to fall, the Bulls Power histogram fall below the zero line.
The Triple Screen technique for this indicator suggests identifying the cfds price cfds trend on a higher chart interval (like daily time frame) and applying the bulls power on a lower chart interval (like hourly time frame). Signals are traded according to the indicator but only in direction of the long term cfd trend in the higher time frame.