How to Use Support & Resistance to Trade CFD
In the above previous lesson trades examples we have looked at support & resistance levels that were not broken. These points held because they were strong enough.
However, sometimes support and resistances levels are not strong enough to stop movement of the cfds price moving in a certain direction. When cfds price moves past these support and resistance points we say that these levels have been broken. That is why we always use a stop loss when trading these levels, just in case they do not hold.
But what happens when these levels are broken, well the levels change one to the other, for examples
- When a support is broken it becomes a resistance
- When a resistance is broken it becomes a support
Using charts, the examples below show an illustration of what happens when these levels break:
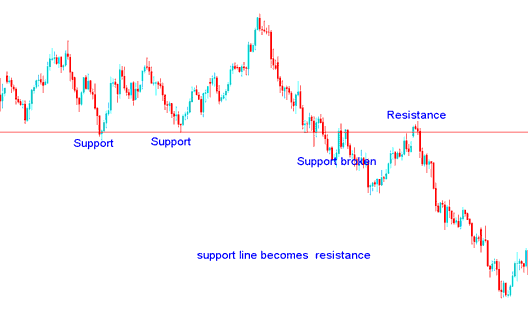
Support is broken it becomes a resistance
In the cfd example shown below, the support that had been tested two times could not hold the third time, the sellers were able to push the cfds price down past this level.
However, the cfds price bounced back up again, but this time the cfds price could not go up beyond this line. The cfds price was there after quickly pushed down by the sellers. This was because the line that was a support had now turned into a resistance.
In cfd trading when a support is taken out, the stop losses placed below that level are also taken out, thus reducing the momentum that the buyers had. This give sellers an opportunity to short sell the cfds & place their stops just above this level which now turns into a resistance level.
Resistance is broken it becomes a support
In the cfd example shown below using the cfds chart, the resistance level that had been tested two times could not hold the third time, the bulls were able to push the cfds price up past this level.
When the cfds price tried to go down again it could not go lower than this level. The cfds price was there after quickly pushed further upwards by the buyers. This was because the line that was a resistance had now turned into a support. This is what happens in cfd trading, when a resistance level is broken it turn into a support level.
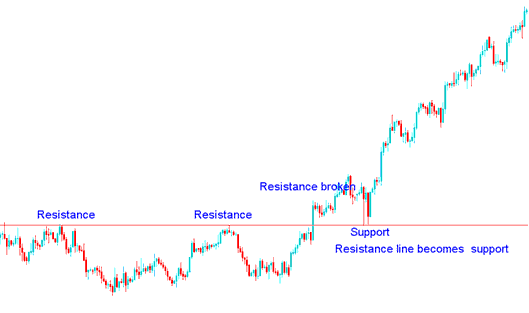
Traders who had closed their short sell cfds trades will now open long trades & place their stop losses just below this level.
Major and Minor Resistance Areas
In cfd charts the resistance & support levels formed are either major resistance/support points or minor resistance/support points.
Major Resistance/Support levels
In Major Resistance/Support levels cfds price will stay at this level for some time, either the cfds price will consolidate at this point or form a rectangle cfd chart pattern when cfds price gets to this point. This level will be tested several times before it is either broken or it holds and cfds price does not get to move past this resistance/support level.
The above examples are good examples of major Resistance and Support Levels.
Minor Resistance/Support levels
In minor resistance & support points the cfds price will quickly form these points in the short term & the price also moves quickly past these resistance and support areas.
Upward CFD Trading Trend: The pattern of this minor resistance and support points will form a series of areas whose general direction is upwards.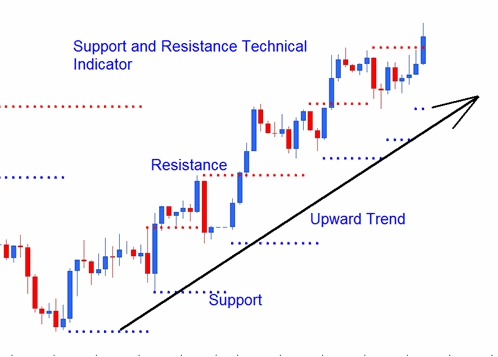
Upward CFD Trend Series of Support and Resistance
Downward CFDs Trend: The pattern of this minor resistance & support points will form a series of areas whose general direction is downwards.
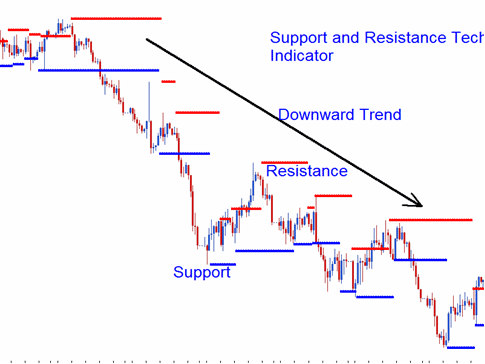
Downward CFD Trend Series of Support and Resistance