Williams Percent R Trading Analysis & Williams Percent R Trading Signals
William % R Indicator Developed by Larry William
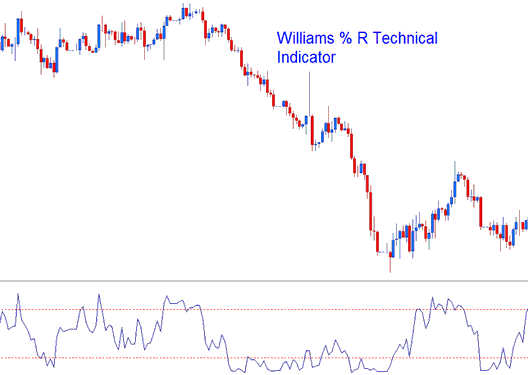
William Percent R technical indicator is pronounced as Williams % R technical indicator. Williams %R is a momentum oscillator trading used to analyze over-bought and over-sold levels in the markets.
The Williams Percentage Range oscillator trading is similar to the Stochastics Technical indicator, apart from that fact that the Percent R is drawn up side downwards on a negative scale that's from 0 to -100 and the technical indicator doesn't apply a smoothing out factor.

Williams %R, Percent R Technical Indicator - Indicators
The Williams %R analyzes the association of the closing prices relative to the High & Low range over a chosen and selected number of n candlesticks.
- The closer the closing price of a candlestick is to the highest high of the range chosen the closer to zero the % R reading and value will be.
- The closer the closing price of a candlestick is to the lowest low of the range chosen the closer to -100 the % R reading will be.
When doing technical analysis a gold trader should ignore the minus(-) sign placed before the value, for example -40, the - sign should be ignored, just remember indicator readings are placed in an up side down kind of manner.
- At zero: If the closing price of the candle is equal to the highest high of the range the Williams % R reading and value will be 0.
- At -100: if the closing price of the candle is equal to the lowest low of the range the Williams %R reading will be -100.
William Percentage R Indicator
Overbought/Over-sold Levels on Trading Indicator
- Overbought- William Percent R values from 0 to -20 are considered and regarded overbought while
- Oversold - William Percent R values from -80 to -100 are considered and regarded oversold.
As for overbought/oversold levels it is best to wait for gold to change direction before taking a signal in the opposite market trend direction. For Example if gold is oversold it is best to wait for the trend to reverse & start to head in an upward direction before buying gold.
Trend Reversal Trade Signals
The William %R indicator used to predict a trend reversal signal when trading gold. The William % R indicator always predicts a reversal using the following method
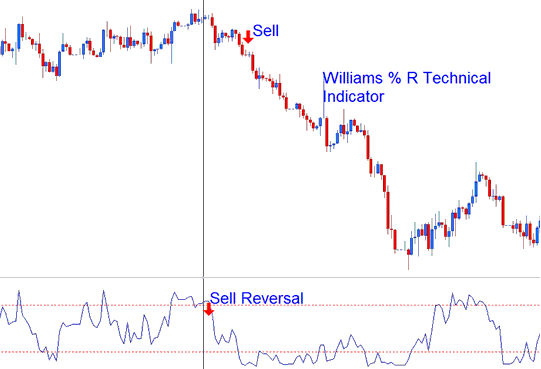
Bearish Reversal Trade Signal- William Percentage Range technical indicator forms a peak and turns down a couple of days before the market trend peaks & turns down. The example depicted and explained below highlights %R giving a reversal gold signal before price begins to head down and change to a down-trend.

Bearish Reversal Gold Trade Signal after Uptrend
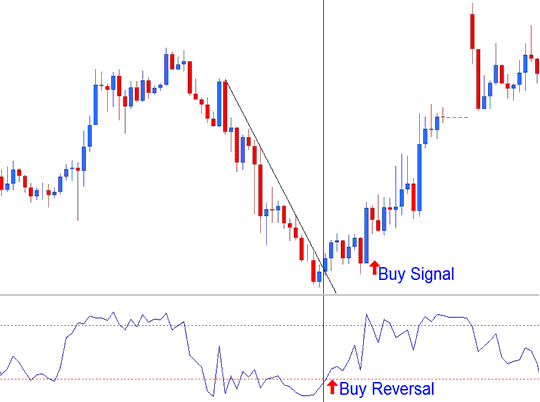
Bullish Reversal Trade Signal- William % Range technical indicator forms a trough & turns up a couple of days before the market trend bottoms & turns up.

Bullish Reversal Gold Trade Signal after Downtrend
Learn More Tutorials:
- MT5 XAU USD Technical Indicators Insert Menu on MT5 Insert Menu Options
- Trade with Alligator Strategies
- Information on Low Spread Brokers Offering Low XAUUSD Spreads with Zero Commission
- How Can I Open a Real MT5 XAU USD Account on the MetaTrader 5?
- One of the Best XAUUSD Account Bonus Including Lot Rebates & Gold Cash Back
- What is the Interpretation of Charts?
- Why Use Your Gold Broker's VPS to Run XAU/USD EA Expert Advisor Bots
- XAU/USD Define a Trend on XAUUSD Charts
- List of Best Technical XAU USD Indicators for Gold
- How Do I Trade DeMark Projected Range Indicator Sell Trade Signal?
