Strategies for Trading Bullish and Bearish Divergence Patterns
In trading, regular divergence is used as a possible sign that a trend might change, and gold traders use it when they are looking for a place where the price might change and start going the other way. That is why this trading method is used as a way to enter trades with little risk and also to exit trades accurately.
This specific approach is a low-risk technique designed for selling near market tops or purchasing near bottoms, thereby minimizing the exposure on trade positions relative to the potential payoff. Despite this, it generates numerous false breakout or whipsaw signals, leading many traders to advise against its utilization.
Traders use divergence to spot the best exit for a winning position. Look for this pattern to set your take-profit spot once the trade shows gains.
There are two types, based on the direction of the trend:
- Classic Bullish divergence
- Classic Bearish divergence
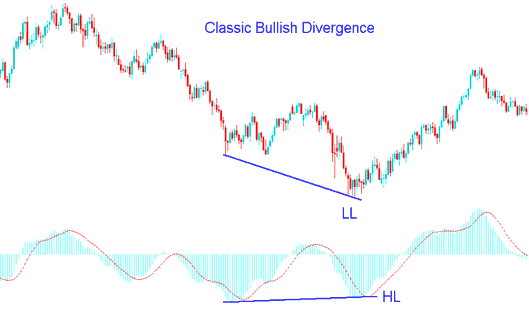
XAU/USD Classic Bullish Divergence
The classic bullish divergence pattern manifests when the asset's price creates lower lows (LL), whereas an oscillator exhibits higher lows (HL). The accompanying example serves to vividly illustrate this specific setup configuration.

XAU/USD Classic Bullish Divergence Trading Setup
This illustration uses MACD as a divergence technical indicator.
From the example illustration revealed above price made a lower low(LL) but trading indicator made a higher low(HL), this highlights there is a divergence setup between the price and the technical indicator. The signal warns of a possible price trend direction reversal.
Classic bullish diverging signal warns of a possible reversal in the trend from downwards to upwards. This is because even though the price headed & moved lower the volume of sellers(bears) that moved price lower was less as depicted by the MACD indicator. This signifies underlying weakness of the down-ward trend.
Classic bearish Divergence Trade Setup
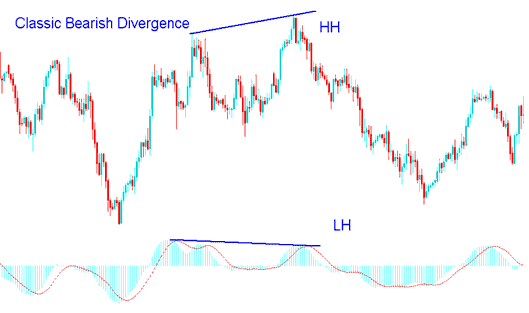
A classic bearish divergence happens when price hits a higher high but the oscillator shows a lower high. The screenshot below illustrates it.

XAUUSD Classic Bearish Divergence
MACD indicator is also used in this example.
Looking at the example above, price made a higher high, but the technical indicator showed a lower high. That's a clear divergence between price and the indicator. This is a warning sign - a possible trend reversal could be coming.
Classic bearish diverging signal warns of a possible change in the trend from upwards to downward. This is because even though the price headed & moved higher the volume of the buyers who moved price higher was less as depicted by the MACD technical indicator. This indicates the underlying weakness of the upward trend.
Looking at the picture above, if you had traded using a divergence setup, you would have received helpful hints for deciding when to start or end your trades at the best times. However, just like other technical indicators, divergence signals can sometimes be misleading. Because of this, it's always a good idea to double-check the divergence trading hints with other indicators like the RSI, MAs, and Stochastics Oscillator Indicator.
A good indicator to combine classic diverging setups is the stochastic oscillator and wait for the stochastic oscillator lines to move in the direction of the divergence trade setup so that to confirm the signal.
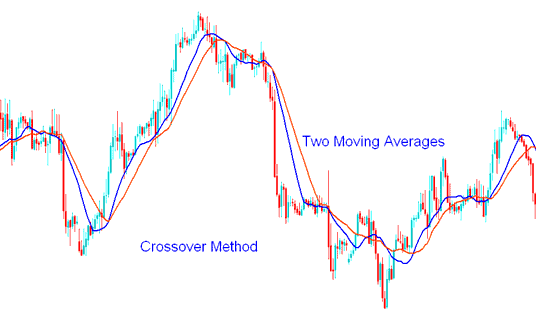
Pair it with the moving average (MA) indicator. For XAUUSD gold trading, try the moving average crossover strategy.
Examples of Moving Average Cross over Technique Strategy

After spotting divergence, a gold trader waits for a moving average crossover in the same direction. For bullish divergence, look for an upward crossover. For bearish, seek a downward one. This confirms the trade signal.
By integrating classic divergence trading signals with additional indicators, traders can mitigate the risk of being caught in false signals. This approach allows them to wait until the market has confirmed a reversal before making trades, reducing the likelihood of attempting to predict market tops and bottoms.
Explore Additional Tutorials and Courses:
