MetaTrader 4 Candles Charts
A chart is a graphical illustration of price movement of a instrument over a given time period.
Charts use a grid layout. Traders pick their preferred XAUUSD timeframe, like hourly, daily, or 1-minute.
Three methods help create charts. The chart type depends on how you draw them.
Chart Types: Candlestick, Bar, and Line Charts
- Line charts
- Bar charts
- Candles charts - Most popular
MetaTrader 4 Line Charts
A single line is drawn from 1 closing price to the next, forming a continuous line.
This particular chart type only conveys minimal data on the screen, rendering it generally unpopular among traders: in fact, this charting style is seldom utilized by the trading community.
Line charts in gold trading skip key details like open, high, and low prices. These are missing from the graph.
This makes this type of line chart to be considered sketchy by xauusd technical analysts.
The chart below portrays an example of a line chart.

MT4 Bar Charts
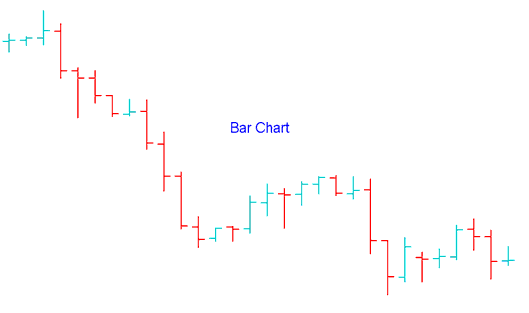
Bar Charts - This type of chart shows the opening, closing, the high and the low, for a particular xauusd price interval & is represented by bars that look like the ones drawn - thence its name bar charts
- Bar Charts - bar chart has a vertical bar showing the total xauusd gold price movement.
- Left horizontal bar the opening
- Right horizontal bar the closing
- High & low denoted by the highest & lowest point
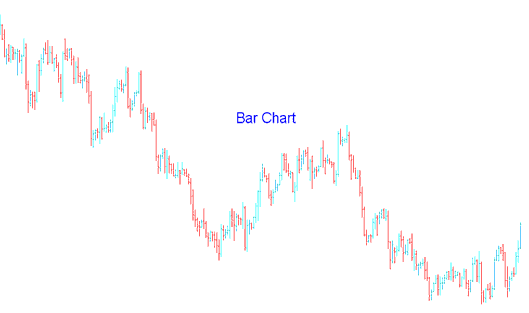
However, these bar charts aren't very easy to work with, especially when they aren't magnified. It becomes very hard and difficult to interpret the bar charts with ease when trading the market thus making them not to be very popular among the traders.

A Bar chart that isn't magnified makes it hard to view the opening & closing price as depicted by this exemplification:
MetaTrader 4 Candles Charts
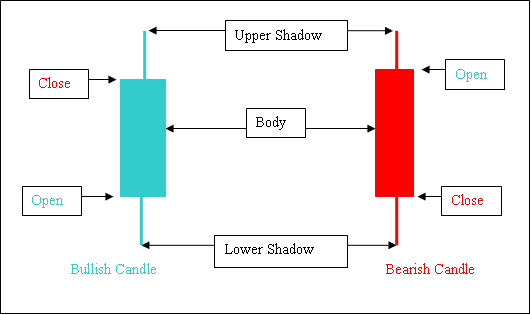
Candles Charts - This trading chart is used the most and looks like candlesticks, which is why they are called candlesticks charts.
Candlestick charts depict the opening, closing, high, and low prices for a specific gold price interval.
The distance between the opening and closing price of xauusd gold is referred to as the candle's body.
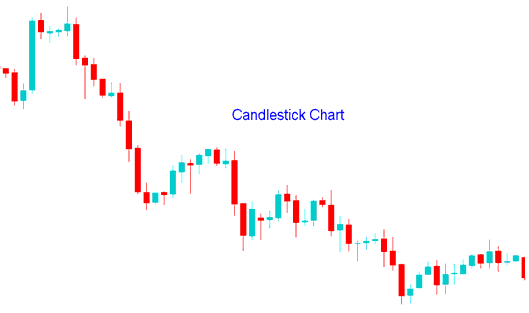
Candlestick charts top the list for online traders. They make market reading straightforward. These charts reveal plenty on price action. That's why they're standard for Gold trades.
Candles Charts
Below shows examples of candlestick charts. For more, read the lesson on Japanese candlesticks. It covers patterns for XAUUSD trading.
Guidance on Selecting and Choosing Specific Chart Visual Styles in MT4 Trading Software
To make any kind of chart on the MT4 Program, a trader can click the buttons below that are on the MT4 program.
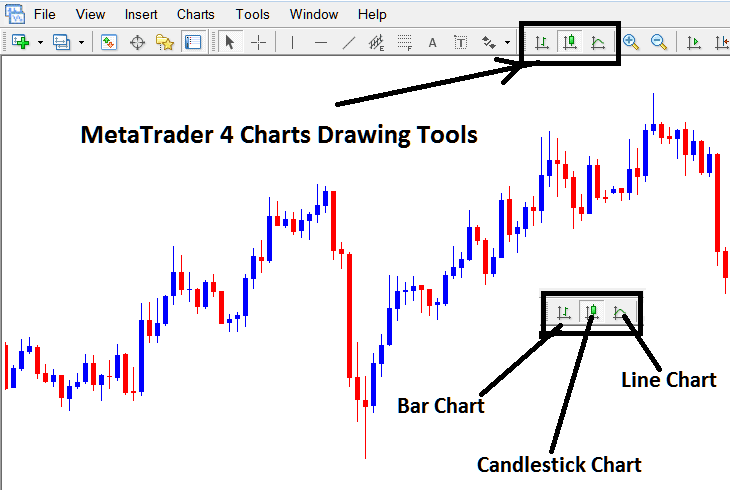
Drawing Charts on MT4 Platform Software
- To Choose a Bar Chart Press the Bar Button
- To Choose a Candles Chart Click the Candlestick Button
- To Select & Choose a Line Charts - Click the Line Button
Get More Lessons and Topics:
