Reversal Chart Patterns: Head and Shoulders & Reverse Head Shoulders
Head and shoulders XAUUSD Trading Pattern
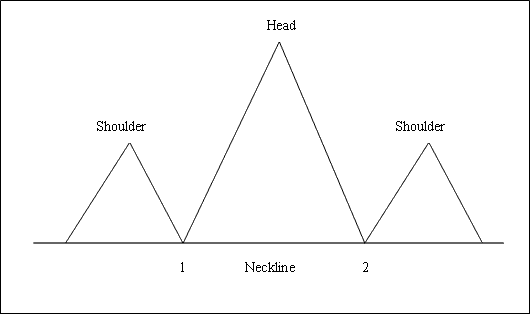
This is a reversal chart pattern that forms after an extended Gold upward xauusd trend. It is made up of three consecutive peaks, the left shoulder, the head & the right shoulder with 2 moderate troughs between the shoulders.
This gold pattern is considered complete once xauusd price penetrates and moves below the neckline, which is drawn by joining the two troughs between the shoulders pattern.
To go short, Gold traders place their sell stop xauusd trade orders just below neck line.
Summary:
- This Gold pattern forms after an extended move upwards
- This formation indicates that there will be a reversal in the xauusd market
- This formation resembles head with shoulders thus its name.
- To draw the neck-line we use chart point 1 & point 2 as shown below. We also extend this line in both directions.
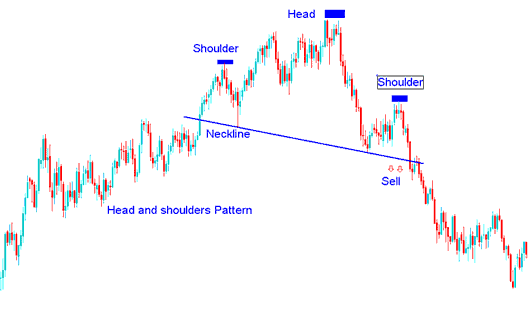
- We sell when the price breaks out below the neck line point: see the trading chart below for explanation.
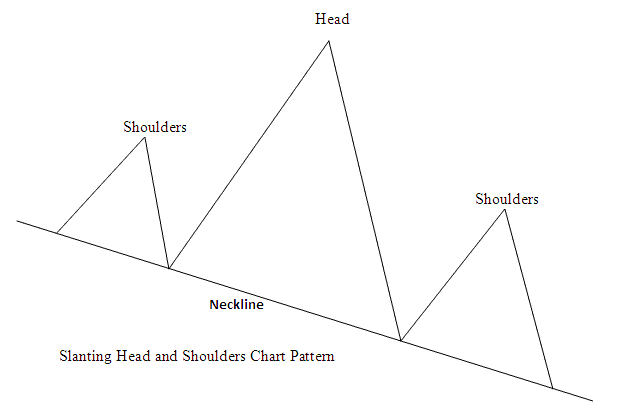
Or the head and shoulders can also form on a slanting neck line, like the xauusd trading example illustrated and explained below:
Example of Head and Shoulders Pattern on a Gold Chart
Head and Shoulders Pattern
This xauusd chart pattern can also be formed on a slanting neck line, like the one above, the neck-line does not have to be necessarily horizontal.
Reverse Head and Shoulders Trading Pattern
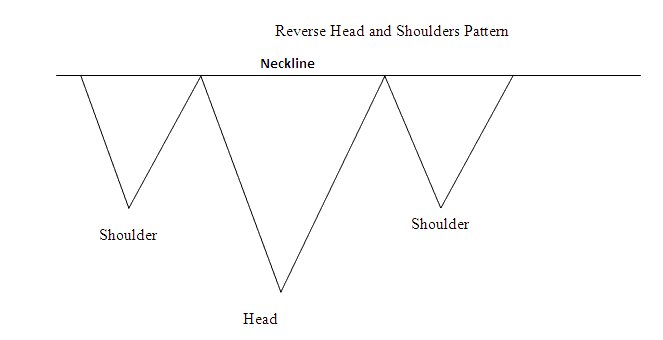
This is a reversal head and shoulders pattern that forms after an extended XAUUSD downward gold trend. It resembles an upside-down head shoulders.
This gold pattern is considered complete once xauusd price penetrates above neckline, which is plotted by joining these 2 peaks between the reverse shoulders pattern.
To go long buyers place their buy stop xauusd trade orders just above neck line.
Summary:
- This Gold pattern forms after an extended move downwards
- This formation indicates that there will be a reversal in the xauusd market
- This formation resembles upside down, thus the name Reverse.
- We buy when price breaks-out above neck line point: see the trading chart below for explanation.
Example of Reverse Head and Shoulders Pattern on a Gold Chart
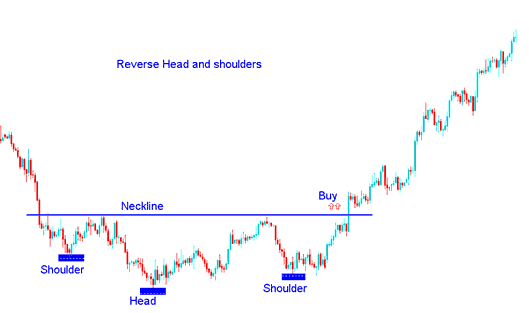
Example of Reverse Head & Shoulders Pattern


