Gold Price Action 1.2.3 method in the Trade Market
Gold Price action is the use of only charts to trade Gold, without use of chart indicators. When trading using this technique, candlestick charts are used. This trading strategy uses lines & pre-determined patterns like 1-2-3 trading pattern which either develops and forms or sequence of bars.
Traders favor this strategy as it offers an unbiased approach to analyzing XAU/USD market trends. By relying solely on trading charts and market movements, decisions can be made based on observable data rather than emotions or speculation.
A lot of traders use this strategy. Even those who rely on technical indicators often mix in some price action with their approach.
The best outcomes with this technique are achieved when signals are combined with line studies to provide additional confirmation. Some of these line studies include trendlines, Fibonacci retracements, and zones of support and resistance.
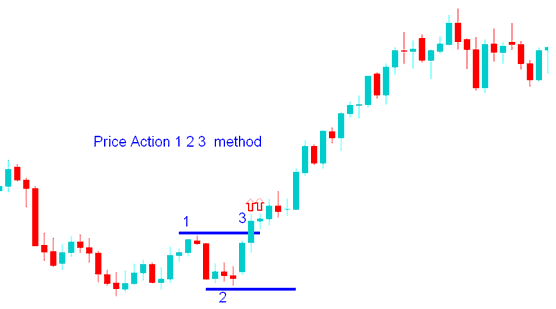
Price Action 1-2-3 Break Out
This methodology employs three distinct chart reference points to ascertain the potential breakout direction for xauusd. The 1-2-3 approach utilizes a peak and a trough, which establish point 1 and point 2. If the market moves above the peak, the resulting trade signal is a long position: conversely, if the market falls below the trough, the signal dictates a short position. The breach of either point 1 or point 2 constitutes the formation of the third reference point.

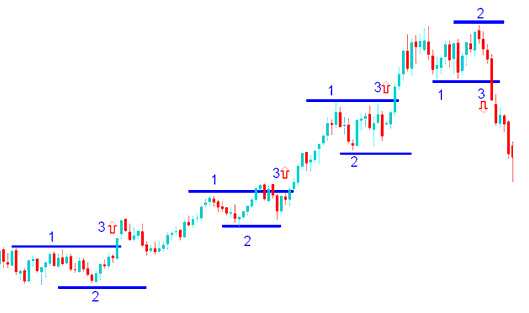
Series of break-outs on Chart

Price action helps investors guess trend paths. Markets trend or stay flat.
A trending market consistently moves in a particular direction, whereas a ranging market typically exhibits sideways movement, particularly after reaching support and resistance zones.
Analyzing price action behavior reveals whether the market is trending, ranging, or reversing its direction.
As with any other strategy this method should also be combined with other confirming indicators to avoid whipsaws. The 1-2-3 pattern setup can give good trading signals in a trending market but will give whipsaws when the market is range-bound, it is best to identify if the market is trending or not before you begin & start using this strategy.
Combining This Strategy with other Trading Indicators
Excellent factors to combine with are:
- RSI
- Moving Average Indicator
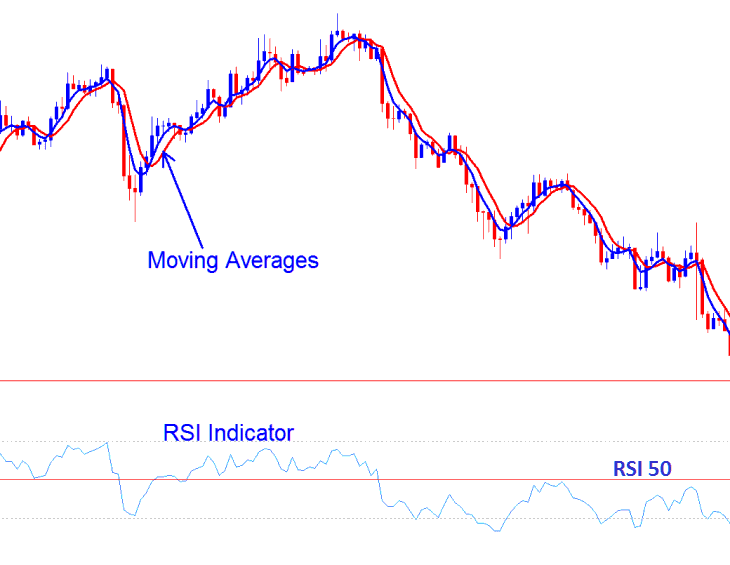
Investors should use these two technical indicators to see if the breakout direction matches the price trend shown by these indicators. If the direction matches the indicators, investors can start a trade in the signal's direction. If not, investors shouldn't trade, as the gold signal might be a false one.
Like any other indicator in Gold trading, price action can experience false signals. To enhance accuracy, this strategy should be used alongside other indicators rather than relying on it as a standalone method.

Combining Together with other Indicators - RSI & Moving Averages
Examine More Subjects & Explanations:
- Gold Price Action: The 1-2-3 Method for Price Breakouts on XAU/USD Charts
- A Beginner's Guide to Using MT5 on Android for Trading XAUUSD
- How to Trade Upwards Gold Trendline Reversal Signals Combined Together with Double Tops Pattern
- XAU/USD Price Action Method with Support Resistance XAU USD Price Action
- How Do I Trade Recursive Moving Trend Average Indicator Buy & Sell Trade Signal?
- How Do I Trade Ehler Fisher Transform Indicator?
- XAU/USD Market Hours
- Classic Divergence XAUUSD Setup
- MT4 XAU/USD Indicator Download Course Tutorial
