Gold Trading Define a Trend on Charts
XAUUSD Define a Trend on Charts
A trend is the tendency of market prices to move in one particular direction for certain period of time.
Prices generally move in trends, the market trend direction can either be upward or downward.
Traders use tools such as trend-lines to spot trends.
Trendlines help to define entry & exit points for trades which are open by traders.
The trend-line define the trend and as long as prices continue to move within the trend line the traders will keep their trade open. Traders only will close their open trade once the prices stop moving within the trend-lines.
The two types of trends are:
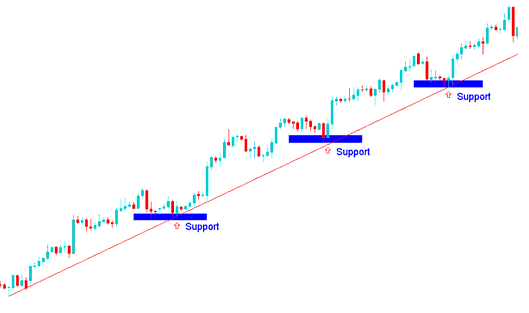
Upward Trend - Drawn using an upward trend line
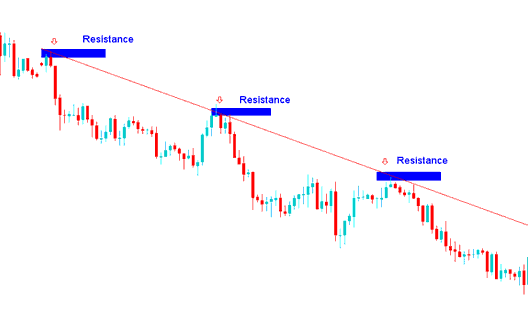
Downward Trend - Drawn using a downward trend-line
Upward Trend
Gold Guide: Trading Draw and Trade Upwards Trend
Upwards Trend on Chart - Drawn using an upward trend line
Downwards Trend
Gold Guide: Trading Draw and Trade Downwards Trend

Down-wards Trend on Chart - Drawn using a downward trend line
The MetaTrader 4 provides charting tools for plotting trends on charts. To draw trend on charts traders can use trend-line drawing indicator tool provided in MetaTrader 4 platform that is illustrated below.

Definition & Definition of a Trend and Trade a Trend
To draw a trend-line in MetaTrader 4 platform & choose point A where you want to begin drawing & then point B where you as a trader want the it to touch. You also can right click on the trend line and on the properties option select the option to extend its ray by ticking "ray check box", if you don't want to extend it, then untick this option in your platform.
trend is your friend. Is a popular phrase among traders because you as a xauusd trader never should trade against it. This is the most reliable method to trade because once prices begin to move in one direction they can continue moving in that specific direction for quite a while in what is referred to as a trend.
Principles of Trading Draw and Define Trend
Use candlestick charts
- The chart points used to draw the market trend are along the lows of the price bars in a rising market. An upward bullish trend move is defined by higher highs and higher lows.
- The points used to draw are along the highs of the price bars in a falling market. A downward bearish trend move is defined by lower highs and lower lows.
- The chart points used to draw the trend lines are extremes points - the high or the low price. These price extreme are crucial because a close beyond the extreme tells traders that the trend of gold might be changing. This is an entry signal or an exit trade signal.
- The more times a market trend is touched by price but it's not broken, the more powerful the market trend signal.
Interpret and Define a Trend on Charts
More Courses & Lessons:
- How Do You Trade MetaTrader 4 Fibonacci Expansions Trading Indicator on MT4 Platform?
- Gann HiLo Activator Gold Indicator Technical Analysis
- How Do You Trade More Gold Charts in MT4 Platform?
- Gold Accounts
- Best XAU/USD Platforms for Beginners
- Gold Define a XAUUSD Trend on Gold Charts
- How to Place Alligator Gold Indicator in Trading Chart in MT4 Platform
- The Most Active Gold Market Overlaps
- How to Create a XAU USD Plan Using a Written Gold Plan


