How Do I Interpret Consolidation Gold Pattern Technical Analysis?
To Analyze consolidation chart patterns - traders need to learn about gold technical analysis of consolidation chart patterns.
Consolidation Chart Patterns
Gold consolidation trading patterns are xauusd patterns with converging trendlines that form a xauusd price consolidation period in the gold market & this forms a symmetrical triangle pattern.
The technical analysis buy signal point from a consolidation chart pattern is the upside xauusd price breakout
While a downside xauusd price break out is a technical sell signal.
Ideally, xauusd price breaks-out from a symmetrical triangle consolidation pattern before the xauusd price reaches the apex of the symmetric triangle consolidation pattern.
Gold Trendlines can be drawn connecting the lows & highs of the xauusd price consolidation period - the trend-lines formed are symmetric & converge to form an apex of a triangle.
A xauusd price break out should occur somewhere between 60% to 80% into the consolidation chart pattern - symmetric triangle pattern. An early price break out or late price break out is more prone to failure, & therefore is a less reliable gold breakout signal.
After a xauusd price break-out - the apex forms support level or resistance level for the xauusd price - price which has broken out of consolidation gold pattern should not retrace beyond the apex point. The apex of the gold consolidation pattern is used as a stop loss order setting level for the open xauusd trades.
When consolidation patterns form - traders say that the gold market is taking a break before deciding which is the next direction to take.
These gold consolidation patterns form when the gold market can not decide which direction to move.
Analyze Consolidation Pattern Analysis
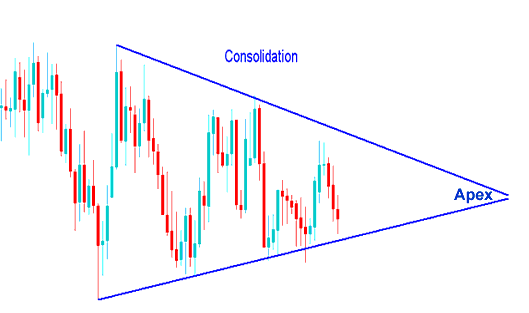
Analyze Consolidation Pattern Analysis
However, this consolidation pattern can't go on forever & just like in a tug of war one side eventually wins, looking at the xauusd chart examples illustrated and described below see how the gold consolidation chart pattern eventually had a xauusd price break out and moved in one direction.
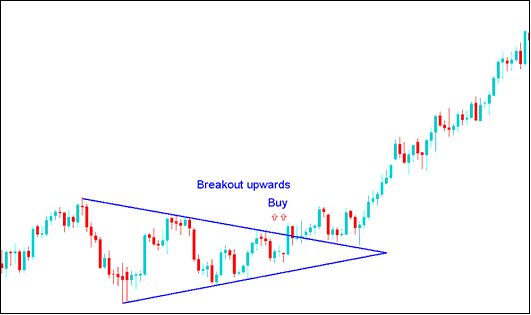
Gold Buy Technical Analysis
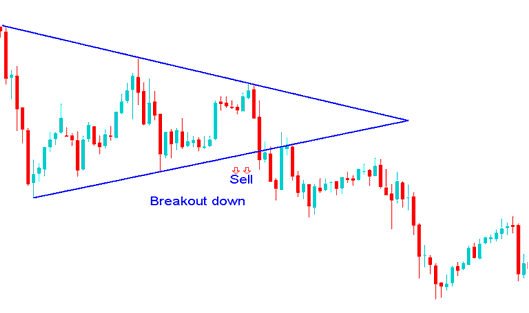
Gold Sell Technical Analysis
Analyze Consolidation Pattern Analysis