How Do I Interpret Downward Gold Trend Technical Analysis?
How to Interpret XAUUSD Downwards Trend Technical Analysis? - A Gold Downwards Trend is when the price forms a series of lower highs and lower lows. Each xauusd price high is lower than the previous high - lower high, and each xauusd price low is lower than the previous low - lower low therefore showing bearish downwards xauusd price movement.
Gold downward trend lines gain more validity each time the xauusd price touches the downward trend line but does not penetrate this downward trend-line. A downward trend remains the general xauusd price movement direction until this series of lower highs and lower lows is broken.
How to Interpret XAUUSD Downwards Trend In xauusd analysis - Gold prices should move within the resistance levels provided by the downward trend line - however, an upside penetration of a gold downward trend line is a reversal signal - and this the first signal that the bearish gold trend xauusd price direction may soon reverse.
Drawing a Downward XAUUSD Trend Line
When it comes to drawing a gold downward trend line on xauusd charts, you need to know that when the gold market is bearish -prices form lower lows and lower highs forming a general gold downward market direction. These lower highs are the points which are used to plot the downward trend line.
To draw this downward trend line setup we use resistance levels and to draw this downward trend line correctly two resistance levels are needed. When xauusd price touches this downward trend line - then gold traders will open sell xauusd trades and place stop loss orders just a few pips above the downward sloping resistance levels shown by the downward trend line:
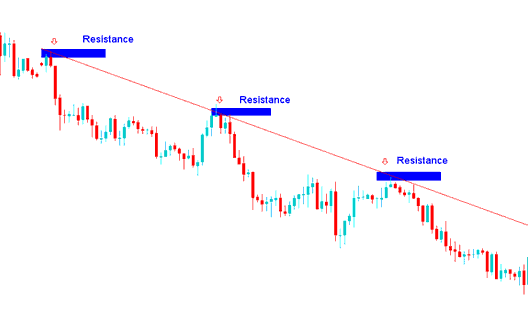
How to Interpret a Downward Gold Trend Technical Analysis - How to Interpret a Downwards Trend Technical Analysis?
How to Trade Downward XAUUSD Trend Line
When trading with this downwards trend line trading strategy - this downward trend line setup will explain general direction of the xauusd price as downward and therefore gold traders will only open sell xauusd trades. These are the xauusd price support levels where if xauusd price retraces then these zones will provide strong resistance levels. This is why many sellers wait until xauusd price retraces upward and hits these xauusd price retracements levels to open their sell xauusd trades. Gold trades opened at these trend line resistance levels have a high Risk : Reward Ratio with minimum drawdown.
For Examples - in the above gold downward trend line setup - a trader would have opened sell signals at the resistance level 1, resistance level 2, resistance level 3 and these sell xauusd trades would have made a profit with minimum amount of xauusd trading drawdown - retracement.
How to Draw a XAUUSD Downwards Channel
A gold downward channel is drawn by drawing another line that is parallel to the downward trendline & then adjusting this line to touch the bottom boundary of the xauusd price downward movement. This then forms a gold downward trading channel and as long as the price stays between this gold channel the general downward xauusd price direction will continue being bearish and moving downwards.
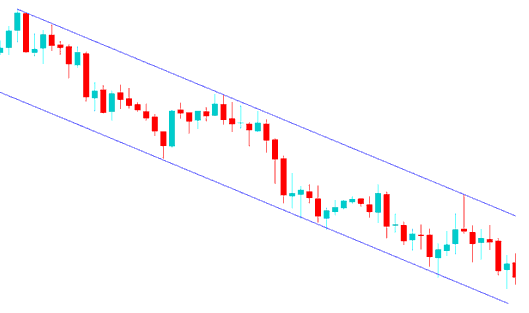
How to Analyze XAUUSD Downwards Trend Line Technical Analysis
How Do I Interpret XAUUSD Downward Trend Trading Analysis