How Do I Analyze XAUUSD MT4 Chart Technical Analysis?
There are 3 types of gold charts used in MetaTrader 4: MT4 Line Chart, MT4 Bar Chart and MT4 Candlesticks Chart - How to Analyze MT4 XAUUSD Chart Technical Analysis for Beginner Traders.
How to Interpret MT4 XAUUSD Chart Analysis
How Do I Interpret XAUUSD MT4 Line Chart Technical Analysis - MT4 line charts plot a continuous line connecting closing xauusd prices.
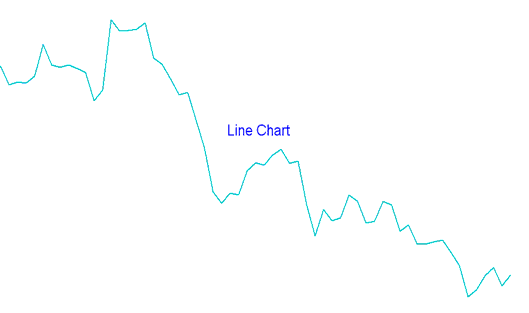
How Do I Interpret XAUUSD MT4 Chart Technical Analysis?
How Do I Interpret XAUUSD MT4 Bar Chart Technical Analysis - gold bar charts are displayed as sequence of OHCL bars. OHCL represents OPEN HIGH LOW & CLOSE. The Opening xauusd price is displayed as a horizontal dash on the left & closing xauusd price as a horizontal dash on the right.
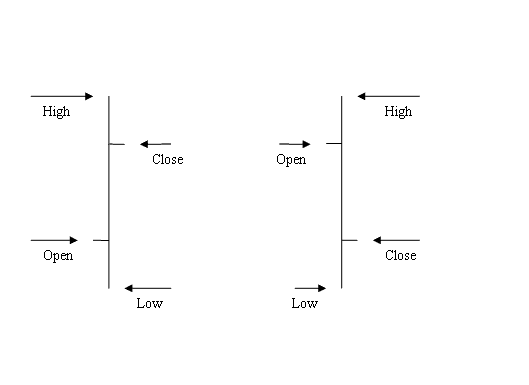
How Do I Interpret XAUUSD MT4 Chart Technical Analysis?
The main disadvantage of a MT4 bar chart is that it is not visually appealing, therefore most traders don't use them.
How Do I Interpret XAUUSD MT4 Candlesticks Chart Technical Analysis - these candlesticks gold MT4 Chart use the same price data as bar charts - open, high, low, and close. However, they in a much more visually identifiable way that look like a candlestick with wicks on both ends.
How to Interpret Candlesticks MT4 XAUUSD Chart Technical Analysis
The rectangle part is called the body.
The high and low are described as shadows & drawn as poking lines.
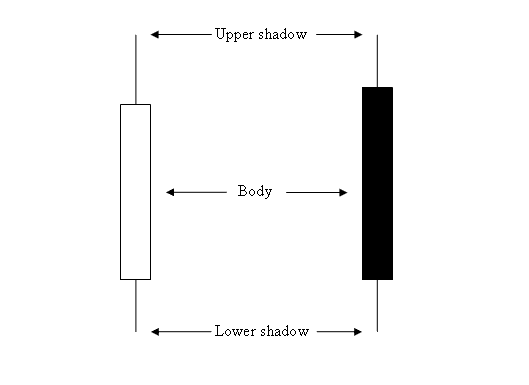
How to Analyze MT4 XAUUSD Chart Analysis
The color of the xauusd trading candle is either blue or red:
- - Blue or Green Color Candles - Gold Prices moved upward
- - Red Color Candlesticks - Gold Prices moved downward
Most xauusd trading softwares like the MT4 Gold Trading Platform, use colors to mark the direction of the xauusd price. MetaTrader 4 Gold Chart Candles colors used are blue or green: when price moves upwards, color of MT4 Gold Chart candlestick is blue: when price moves downward, color of MT4 Gold Chart candle is red.
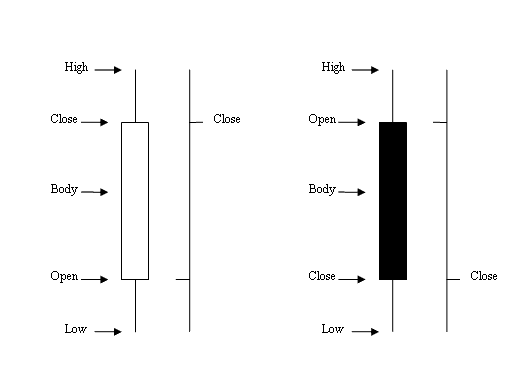
How to Analyze MT4 XAUUSD Chart Analysis
When MT4 Candlesticks charts are used it is very easy to see if the xauusd price moved up or down as opposed to when MT4 bar charts are used.
The Japanese candles charts techniques also have very many patterns & formations which are used to trade the Gold Markets. Different types of XAUUSD Candlesticks Analysis have different technical analysis - How to Analyze MT4 Gold Chart Technical Analysis Beginners Tutorial - How Do I Analyze MT4 XAUUSD Chart Analysis? - How to Analyze MT4 XAUUSD Chart Technical Analysis for Beginner Traders:
How to Interpret MT4 XAUUSD Chart Technical Analysis for Beginner Traders
The above MT4 XAUUSD Chart Analysis is what makes the Japanese MT4 gold charts candles XAUUSD Chart Analysis popular among gold traders & it's why this type of technical MetaTrader 4 Gold Chart analysis are the most widely used when it comes to interpreting the xauusd market.
MT4 candles charts can be selected on the MT4 charts toolbar - where a trader can specify the type of charts they want to trade with on the MT4 platform as Candlesticks Chart Technical Analysis.
How Do You Analyze MetaTrader 4 XAUUSD Chart Technical Analysis? - How to Analyze MT4 Gold Chart Technical Analysis Beginners Guide