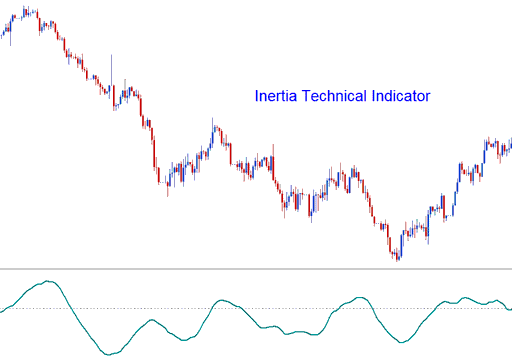
Inertia Analysis and Inertia Trading Signals
Developed by Donald Dorsey & was originally used to trade Stocks & Commodities market, before traders took it & started trading the market using this technical indicator.
Dorsey conferred the name "Inertia" upon this tool based on his conceptualization of market movement. He posited that a market trend is fundamentally a consequence of inertia, meaning it requires substantially greater external force to reverse a trending market than to sustain its current trajectory. Therefore, a market trend is effectively a measure of the market's inertia. This indicator functions as an oscillator operating on a scale from zero to one hundred, generating trading signals via the 50 level centerline crossover strategy.

In the realm of physics, the concept of Inertia is defined based on mass and the trajectory of motion. While the trajectory of a trend's movement can be readily ascertained using standard market analysis methods, defining the "mass" proves considerably more challenging. Dorsey proposed that the volatility of a financial asset might indeed constitute the most straightforward and accurate metric for measuring inertia. This premise supported the utilization of the Relative Volatility Index (RVI) as the foundation for a trend indicator. Consequently, the Inertia technical indicator is constructed from: the RVI smoothed by linear regression.
Gold Analysis and How to Generate Trading Signals
Trading signals created using this indicator are relatively straightforward to interpret. Below are examples showcasing how buy and sell signals are derived through charts utilizing the Inertia indicator.
Bullish Buy Signal
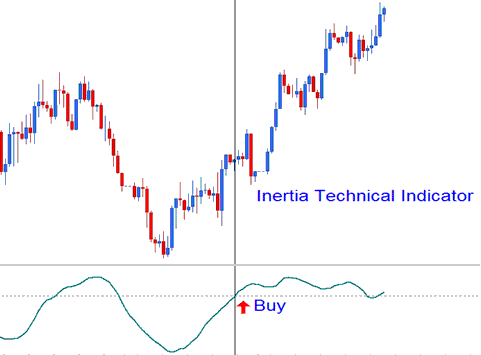
If the Inertia number is more than 50, that means there's positive inertia, which tells us the long-term trend is going up, as long as the technical technical indicator stays above 50. If the indicator drops below 50, that means it's time to sell. The chart here shows how a signal to buy is created.

Upwards Trend - Bullish Signal
Bearish Sell Signal
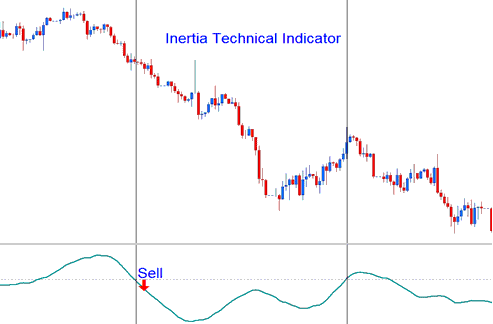
If the Inertia score is less than 50, it means there is negative inertia, which suggests that the overall trend is going down, as long as the technical indicator stays below 50. If it rises above 50, it signals that it's time to exit the trade. The chart below illustrates how a sell signal is created.

Downward Trend - Bearish Signal
Study More Guides & Tutorials:
- A list of recommended technical indicators for gold (XAUUSD) traders to consider.
- MT4 Margin Level for XAUUSD: How to Calculate Leverage on MetaTrader 4
- How do you set up the Gold CCI indicator on a trading chart?
- How to Trade the Inverse Head & Shoulders Pattern in Gold
- MetaTrader Desktop Software: Different Versions Compared
- MT4 Meta-Editor lesson showing how to set Expert Advisors(EAs)
- How to Adjust Gold Leverage Within MT4 Platform
- Gold Leverage and Margin Basics: Account Equity, Used Margin, Free Margin Explained
- Where can beginners study gold trading online?
- How to Change a Stop Loss on an XAU/USD Order in MetaTrader 5

