MA Convergence/Divergence Analysis and MACD Signals
Developed & Created by Gerald Appel,
The MA Convergence/Divergence stands out as one of the most straightforward, dependable, and frequently applied trading indicators.
It is a momentum oscillator and also a trend-following indicator.
Construction
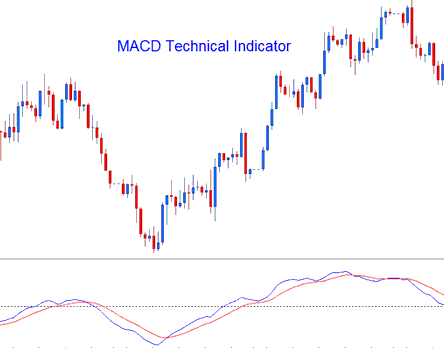
This indicator calculates the difference between two moving averages and plots it as the 'Fast' line. A 'Signal' line is then derived from the 'Fast' line and displayed within the same window panel.
- 'Fast' line - Blue Line
- 'Signal' line - Red Line
The 'standard' MACD values for the 'Fast' line is a 12-period exponential MA and a 26-period exponential MA and a 9-period exponential moving applied to the fast-line, this draws 'Signal' line.
- Fast-line = difference between 12 & 26 exponential MAs
- Signal Line = MA of this difference of 9-periods

Analysis and How to Generate Trading Signals
The MACD indicator is commonly used as a trend-following tool and proves most effective in analyzing and interpreting market trends. There are three primary methods for using the MACD to generate trading signals.
XAUUSD Cross-overs Gold Signals:
Fast line/Signal line Cross over:
- A buy signal gets generated when Fast Line crosses above Signal-line
- A sell signal gets generated when FastLine crosses below Signal Line.
Finally, you must commit to diligent study and significant effort - master every analytical concept presented here and apply these superior analytical methods and principles using a complimentary practice demo account.
Zero Line Crossover Signals:
- When the Fast Line crosses above zero center-line a buy signal gets generated.
- when the Fast Line crosses below zero center line a sell signal gets generated.
Divergence Trade:
Spotting differences between MACD and price action works well. It helps find spots for reversals or trend continuations. Two main types exist.
- Classic Divergence Trade Setup Signals
- Hidden Divergence Trade Setup Signals
Overbought/Oversold Conditions:
The MACD is also utilized to pinpoint potential instances of overbought or oversold conditions within price fluctuations.
These specific zones are established/derived when the shorter MACD lines diverge considerably from the central median line, signaling an overextension in price action, which typically previews a forthcoming return to more rational price levels.
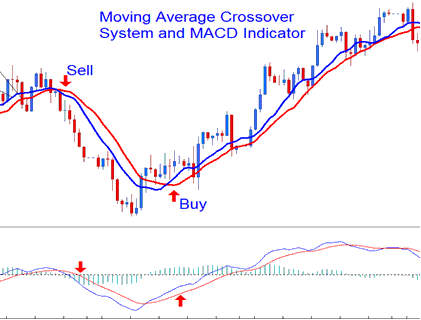
MACD & Moving Average XAUUSD Cross-over System
This indicator can seamlessly be combined with other strategies to form a trading system. A particularly effective pairing is with the Moving Average crossover method, where a trade signal is generated when both indicators align in the same trend direction.

Analysis in XAUUSD Trading
Study More Lessons:
- Customizing XAUUSD Line Studies Tool Bar Menu in MetaTrader 4 Software
- How Do You Use List of XAU/USD Price Movement Trading Plans?
- How to Activate a MetaTrader 4 Expert Advisor on MetaTrader 4 Platform
- Analyzing Double Bottom Reversal Patterns for XAUUSD within the Context of Bollinger Band Indicator Signals?
- How Do You Trade a Reversal in a Downtrend?
- Identifying the Double Bottom Chart Configuration When Trading Gold
