Linear Regression Acceleration: Buy and Sell Signals
Linear Regression Acceleration: How to Spot a Buy Signal
Evaluating a Buy Signal Triggered by the Linear Regression Acceleration Indicator
Instructions for Reading Buy Signals Based on the Linear Regression Acceleration Indicator:
This Linear Regression Acceleration buy signal tutorial describes in detail how to read buy signals using the Linear Regression Acceleration as is shown in the trading example below:
Analysis Buy Signals Using the Linear Regression Acceleration Indicator
Linear regression acceleration - how to read the indicator for sell signals.
Evaluation of Sell Signals via Linear Regression Acceleration Indicator Application
Steps on how to study sell signals using Linear Regression Acceleration trading indicator:
This Linear Regression Acceleration sell signal tutorial explains in detail how to read sell trading signals using the Linear Regression Acceleration like as shown in the example:
Analysis Sell Signals Using the Linear Regression Acceleration Indicator
Analysis Linear Regression Acceleration Sell and Buy
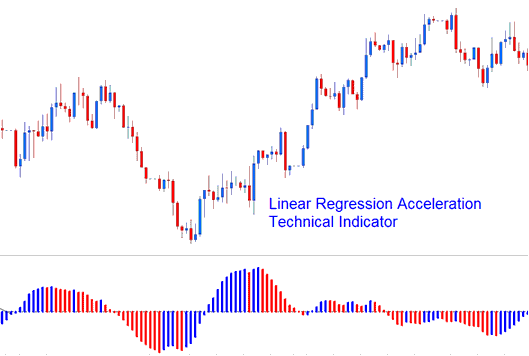
The Linear Regression Acceleration indicator measures changes in the regression line's slope on the current price bar compared to its slope on the previous price bar. The value used to calculate the Linear Regression Acceleration is the normalized acceleration value, which is marked for each price bar formed on the price chart.
Analysis Linear Regression Acceleration Indicator?
If normalized linear regression speed hits 0.30, the line's slope climbs 0.30 per bar.
Likewise, if the slope after normalizing is -0.40, that means the normalized regression line slope goes down by -0.40 for each price candle.
For instance, if the current price bar exhibits a normalized slope value of 0.40 and the preceding price bar's normalized slope reading was 0.20, the normalized acceleration for the current price bar would be calculated by subtracting: 0.40 - 0.20 = 0.20.
NB: It is crucial to realize that a positive acceleration reading does not equate to a positive slope value, it simply means the gradient of the Linear Regression slope is increasing. A negative acceleration reading does not equate to a negative slope value, it simply means the gradient of the Linear Regression slope is decreasing.
Using the Linear Acceleration Regression Indicator
The Linear Regression Acceleration tool provides capabilities for: selecting the price data series, choosing the number of regression periods, applying smoothing to the raw price data before the regression calculation, and selecting the method of smoothing.
Resulting regression slope is displayed as a bi-colored histogram which oscillates above and below 0 centerline mark.
The reference line is set at 0 mark.
- A rising Linear Regression slope: (greater than its previous value 1 bar before) is displayed and shown in the up slope color.
- A declining Linear Regression slope: (lower than its previous value 1 bar before) is displayed using the down slope colour.
Analysis Linear Regression Acceleration Indicator?
Get More Lessons & Topics:
- How Do Use Buy Stop XAUUSD Order on MetaTrader 4 Software/Platform?
- Opening a Real Gold Account on MT4 XAUUSD Platform Explained
- How to Use the Gann HiLo Activator for Buy Signals in Forex
- A Tutorial on Trading Techniques Using the Linear Regression Indicator
- Gold Signal: Spotting XAUUSD Consolidation Patterns
- Lesson on Day Trading Strategies for Gold
- Simple Gold Trading Software - The Best XAU/USD Tools
- How do you use MetaTrader 5's XAUUSD platform on an Android phone?
- Adding arrows to gold charts in MT4 software
- Want to practice with Fibonacci expansion and retracement levels on gold charts? Here's an exercise for each.

