Linear Regression Indicator Analysis - Identifying Sell and Buy Signals
Linear Regression How to Read Indicator Buy Signal
Analysis Buy Signal Using Linear Regression Indicator
Steps on how to read buy signals using Linear Regression technical indicator:
This Linear Regression buy signal tutorial describes in detail how to read buy signals using the Linear Regression as shown in the example:
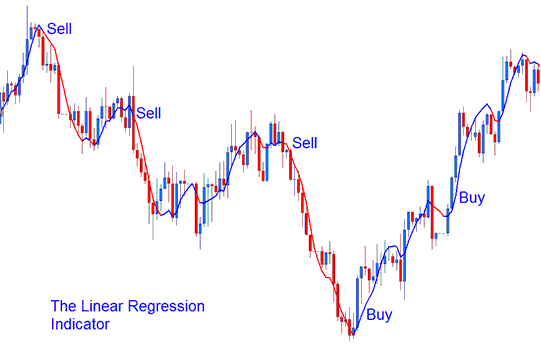
Linear Regression resembles a MA but it has a bi-colour representation.
- Bullish Buy Signal (Blue color) - A rising Linear Regression line - greater than its previous value, 1 previous candle bar before - is displayed and shown in the upwards trend - blue color.
Analysis Linear Regression Indicator?
Analysis Buy Signals Using the Linear Regression Indicator
Linear Regression How to Read Indicator Sell Signal
Analysis Sell Signal Using Linear Regression Indicator
Procedures for Analyzing Sell Signals Using the Linear Regression Technical Indicator:
This Linear Regression sell signal tutorial explains in detail how to read sell trading signals using the Linear Regression as is shown in the example:
Linear Regression resembles a MA Moving Average but it has a bi-color representation.
- Bearish Sell Signal (Red color) - a declining Linear Regression line - lower than its previous value, 1 previous candle bar before - is displayed and shown in the downward trend - red color.
Analysis Linear Regression Indicator?
Analysis Sell Signals Using the Linear Regression Indicator
Analysis Linear Regression Indicator?
More Topics & Lessons:
- Methodologies for Determining Optimal Stop Loss Placements for Gold (XAUUSD) Trades
- Chaikin's Money Flow - XAU/USD Indicator Analysis
- Accessing Candle Charts via the Trading Charts Menu in MetaTrader 4 Software
- How Do I Place a Pending XAUUSD Order on MetaTrader 5 Android App?
- Beginner's Guide to MetaTrader 4 Gold Platform
- How to Use Zigzag Gold Tool in Gold Graph on Gold Software
- Trading XAU/USD Without Leverage: Exploring the Feasibility
- How Do You Trade Fibonacci Expansion Settings on MT4 Software/Platform?
- Trade Gold on the MetaTrader 5 Gold Android XAUUSD App
- The Average True Range Indicator as a Signal Generator on MetaTrader 4

