What is Doji Candles in Gold Trading?
What Does Doji Candle Mean? - Doji Candle Definition
Doji is a candlestick pattern with same opening & closing price. There are different types of doji candle patterns which form on charts.
A doji candle happens when the gold price closes almost exactly where it opened during a certain time period. On a chart, a doji looks like a cross, an upside-down cross, or even just a plus sign.
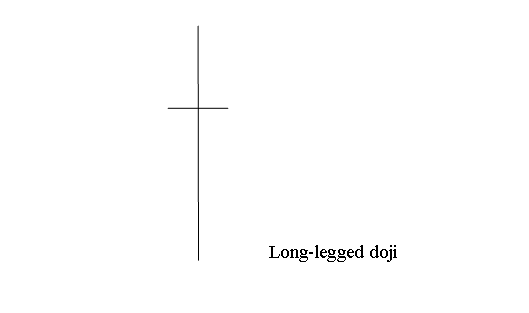
The subsequent visual aids serve to illustrate the diverse structural formations found in doji candlesticks:
A long-legged doji candle features extended upper and lower shadows, with the opening and closing prices around the mid-point. The appearance of a long-legged doji signifies uncertainty among XAU/USD traders, indicating a balance between buyers and sellers (bears).
Below is example screen-shot image screen shot of the Long Legged

Interpreting Doji Candles in Gold Trading - Analysis of the Doji Candle Pattern
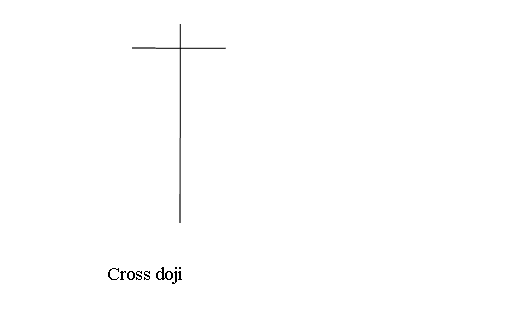
Cross Doji Gold Candle-stick
The cross doji candle pattern looks like this: it has a long lower shadow, a short upper shadow, and the open and close prices are exactly the same.
This gold candlestick pattern formation shows up at market turning points and warns of a possible price trend direction reversal in the market. Below is as example of this Cross doji candle formation

Cross Doji Candle Pattern - Analysis of Doji Candle Pattern
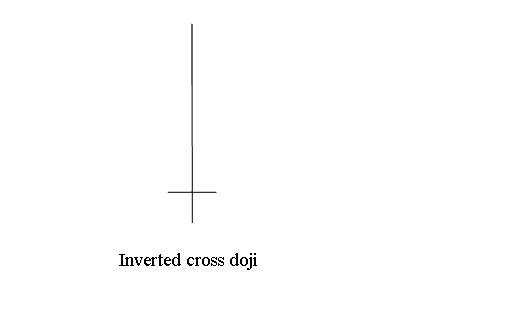
Inverted Cross Doji Candle Pattern
Inverted Cross Doji Candlestick: This formation features a lengthy upper wick and a short lower wick, with the opening and closing prices being identical.
A reversal doji candle often appears at market turning points and serves as an indicator of a possible reversal in price trends. Below is an example illustrating this pattern.

Inverted Cross Doji Candlestick Pattern - Analysis of the Doji Candle Configuration
Analysis of the Doji Candle Pattern: Every manifestation of the doji candlestick indicates market indecision within the Gold market. This arises because while buyers held sway at the peak of trading and sellers controlled the bottom, neither party managed to secure a decisive advantage, resulting in the XAUUSD market closing at virtually the identical gold price at which it opened.
The doji candlestick pattern indicates minimal price movement for XAUUSD over a trading day, often within a range of 0 to 3 pips. Interpreting these patterns requires close observation of small differences between opening and closing prices.
Study More Lessons:
- How Can I Read Balance of Power BOP Indicator?
- How to Generate XAU USD Buy & Sell Trade Signals Using Gold Strategy
- MT4 Candle Recognition Tutorial Course
- Technical Analysis McClellan Oscillator Technical Indicator Buy Trade Signal
- Technical XAUUSD Indicators for Transacting XAUUSD Divergence Trading Setups
- How Can I Save MetaTrader 4 Profile of MetaTrader 4 XAU/USD Charts in MT4 Platform Software?
- How Can I Use Fibo Pullback Levels on MT5?
- XAU/USD 20 Pips Price Range Moving Average(MA) XAU/USD Strategy
- Learn XAU/USD Tutorial Lesson for Beginners
- How Do I Start XAU/USD Guide for Beginners?

