Engulfing Stock Candles Setup Patterns
Bullish Engulfing Candle-stick Setup and Bearish Engulfing Candlestick Pattern
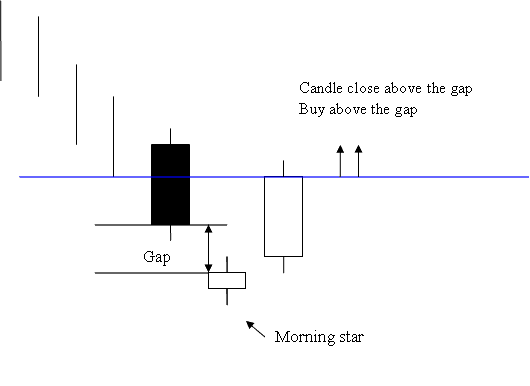
Morning Star Candle Setup
Morning Star Candle Setup
Morning Star Candlestick Pattern
Morning star candle is a 3 day bullish reversal indices pattern.
The first day is a long black candlesticks.
The second day is a morning star which gaps away from the long black candlestick.
Third day is a long white candle which fills the gap.
Filling of the gap and closing of the white candlestick above gap is a strong bullish signal.
Investors and traders should buy indices after the stock price closes above the gap that the morning star candle pattern makes. This confirms that it's a good time to buy stocks based on what this candlestick pattern is showing.
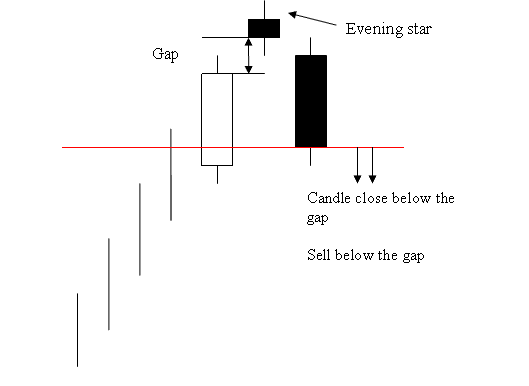
Evening Star Stock Candle Pattern
Opposite of the morning star
Evening Star Stock Candle Pattern
Evening Star Stock Candle Pattern
Evening star candlestick is a 3 day bearish reversal indices pattern.
First day is a long white candlestick.
The second day is evening star which gaps away from the long white candle.
Third day is a long black candlestick which fills the gap.
Filling of the gap and closing of the black candle below gap is a strong bearish signal.
Investors & Traders should execute a sell indices trade once the stock trading market closes below gap setup formation of the evening star. This is the confirmation signal of a sell stock signal generated/derived by this Evening star candle pattern setup formation.
Engulfing Pattern
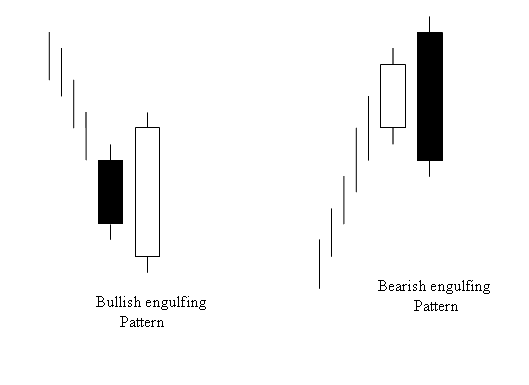
Engulfing is a candle pattern that shows a change in direction, and it can be bearish or bullish based on whether it happens at the end of a falling or rising market trend.
Bullish & Bearish Engulfing Pattern
Bullish and Bearish Engulfing Candlestick Patterns
Colour of the first candle reflects the trend of the day.
The second candlestick must entirely cover the first one and display a color opposite to the current market trend.
For Bullish Engulfing color of the candle should be Blue
For Bearish Engulfing color of the candle should be Red
Learn More Tutorials and Courses:
- How to Add CCI Indicator on Index Chart
- Index Support and Resistance Levels: Examples in Stock Index Chart
- Best Ichimoku for 1H Index Chart
- How to Place MA on Chart
- Recursive Moving Trend Average Indices Indicator Analysis
- Study Index Trade UsTec 100 Indices
- Index Tools & Methods of Stock Index Risk Management
- Gann HiLo Activator Index Indicator Analysis
