Commodity Trading Pivot Points
Pivot points is a set of indicators developed by floor traders in the commodities markets to determine potential turning points, also known as "pivots". These points are calculated to determine levels in which the sentiment of the commodity trend could change from "bullish" to "bearish." Commodities traders use these points as markers of support and resistance.
These points are calculated as the average of the high, low and close from the previous session:
Commodity Trading Pivot Point = (High + Low + Close) / 3
Day traders use the calculated pivot-points to determine levels of entry, stops & profit taking, by trying to determine where the majority of other commodity traders may be doing the same.
A pivot-point is a commodities price level of significance in technical analysis of a financial market that is used by commodity traders as a predictive indicator of commodities price movement. It is calculated as an average of significant commodities prices (high, low and close) from the performance of a market in the prior trading period. If the commodities prices in the following period trades above the central point it is usually evaluated as a bullish sentiment, whereas if commodities price below central point is seen as bearish.
The central point is used to calculate additional levels of support & resistance, below and above central point, respectively, by either subtracting or adding commodities price differentials calculated from previous trading ranges.
A pivot & the associated support & resistance levels are often turning points for the direction of commodities price movement in a market.
- In an up commodities trend, the pivot point and the resistance levels may represent a ceiling level for the commodities price. If commodities price goes above this level the up commodity trend is no longer sustainable and a commodity trend reversal may occur.
- In a down commodity trend , a pivot point and the support levels may represent a low for commodities price level or a resistance to further decline.
The central pivot-point can then be used to calculate the support & resistance levels as follows:
Pivot points consist of a central point level surrounded by three support levels below it and three resistance areas above it. These points were originally used by floor traders on equity and futures exchanges because they provided a quick way for those traders to get a general idea of how the commodity market was moving during the course of the day using only a few simple calculations. However, over time they have also proved exceptionally useful in other markets as well.
One of the reasons they are now so popular is because they are considered a "leading" (or predictive) technical indicator rather than a lagging indicator. All that is required to calculate the pivot points for the upcoming (current) day is the previous day high, low, and close commodities prices. The 24-hour cycle pivot points in this indicator are calculated according to the following formulas:
Central pivot can then be used to calculate the support & resistance levels as follows:
Resistance 3
Resistance 2
Resistance 1
Pivot Point
Support 1
Support 2
Support 3
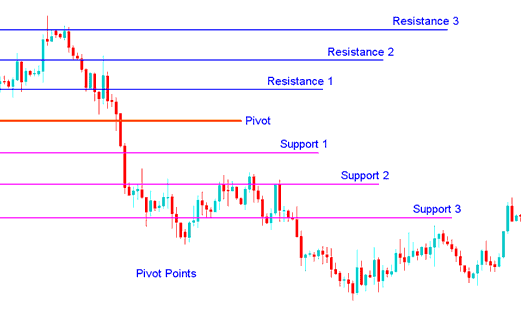
Pivot Points Support and Resistance Levels
Pivot Points as a Commodities tool
The pivot point itself represents a level of highest resistance or support, depending on the overall sentiment. If the commodity market is direction-less ( range bound ) commodities prices will often fluctuate greatly around this level until a commodities price breakout develops. Commodities Prices above or below the central point indicates the overall sentiment as bullish or bearish respectively. This commodity indicator is a leading Commodities indicator that provides signals of potentially new highs or lows within a given chart time frame.
The support and resistance levels calculated from the central pivot point and the previous market width may be used as exit points of the open Commodities trades, but are rarely used as entry signals. For examples, if the commodities price is up-trending and breaks through the pivot point, the first or second resistance level is often a good target to close a position, as the probability of resistance and reversal increases greatly, with every resistance level.
In pivot point analysis 3 levels are commonly recognized above & below the central point. These are calculated from the range of commodities price movement in previous trading period and then added to the central point for resistances & subtracted from it for support areas.
Pivot Points
Pivot levels can be used in many different ways. Here are a few of the most common techniques for utilizing them:
Commodities Trend Direction: Combined with other Commodity Trading analysis techniques such as overbought/oversold oscillators, volatility measurements, etc., the central point may be useful in determining the general trending direction of the market. Trades are only taken in direction of the Commodities trend. Buy trades occur only when the commodities price is above the central point and sell commodities trades occur only when the commodities price is below the central pivot.
Commodity Trading Price Breakouts: In commodities price breakouts, a bullish buy commodity signal occurs when the commodities price breaks up through the central point or one of the resistance levels (typically Resistance 1). A short sell commodity signal occurs when commodities price breaks down through the central point or one of the support levels (typically Support 1).
Commodities Trend Reversals: In commodity trend reversals, a buy commodity signal occurs when the commodities price moves towards a support level, gets very close to it, touches it, or moves only slightly through it, and then reverses and starts moving in the other direction.
To download Pivot points:
https://c.mql5.com/21/9/pro4x_pivot_lines.mq4
Once you download it open it with MQL4 Language MetaEditor, Then Compile the technical indicator by pressing the Compile Button Key & it will be added to your MetaTrader 4.
NB: Once you add it to your MetaTrader 4, the technical indicator has additional lines named Mid-Points, to remove the additional lines open MQL4 Meta Editor(shortcut key-board key - press F4), and change line 16 from:
Extern bool midpivots = true:
To
Extern bool midpivots = false:
Then Press Compile button again, & it will then appear as exactly illustrated on www.tradegoldtrading.com web site.