Do Gold Position Trade with Different Chart Timeframes?
Chart Timeframes
Position Traders
These group of trading are the traders that hold on to their trade transactions for weeks or months. With main objective of earning a big amount of pips, 300 - 1,000 pips.
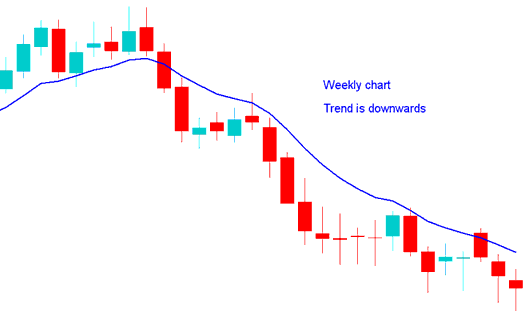
A Position trader using the daily time-frame wants to open short, checks weekly chart timeframe, weekly chart timeframe resembles the one below, since weekly chart shows the market trend is moving down, then decides from the analysis it's okay button to sell.

Gold Position Trade on Multiple Charts - Chart Time-Frames
Gold Position Traders using technical analysis use charts to try & attempt to predict the movement of the price on the charts.
Gold Trading Position traders will sometimes use two or more chart timeframes so as to determine the long-term trend and short term trend.
How Do I Define a Market Trend for Position Trading
Using a system that has Three technical indicators - MA Cross over System, RSI & MACD & using simple trading rules to define the trend. The Trading Rules Are:
Upward Trend
Both MAs Moving Up
RSI above 50 Level
MACD Above Center Line
Downwards Trend
Both MAs Moving Averages Moving Down
RSI below 50 Level
MACD Below Center-Line
Multiple charts time-frames analysis equals using 2 chart timeframes to trade xauusd - a shorter chart timeframe used for trading & a longer chart timeframe to check the trend - chart timeframes that you choose for price action with will depend on the type of trader you are: for Position Traders the chart timeframes used for will be an example of daily chart timeframe and weekly chart timeframe.
Since it is always good to follow the trend when gold trading Position Trading, in Multiple Time Frame Analysis, the longer weekly chart timeframe provides us the direction of the long-term trend when Position trading using the daily Chart Timeframe.
Get More Lessons & Courses:
- How to Use Gold Trend-line Analysis in Gold
- Regulated Broker Online Info
- How Do You Predict XAU USD Trend lines Trend Reversal?
- Technical Analysis Darvas Box Trading Indicator Buy Signal
- Japanese Candles Patterns
- Gold Learning
- How to Trade Ascending Triangle Pattern in Gold
- Lesson Tutorial Price Action Strategies Lesson
- Stochastic Oscillator Gold Indicator
- Gold MT4 Drawing XAUUSD Trend-line Tools


