How Do You Analyze CCI Indicator Buy Signal and Sell Signal?
CCI How to Interpret/Analyze Indicator Buy Signal
How Do I Analyze Buy Trade Signal Using CCI Indicator?
Steps on how to analyze and interpret buy signals using CCI indicator:
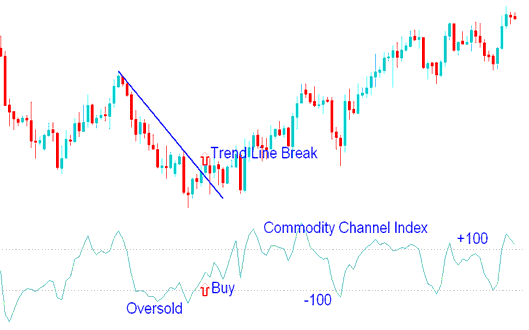
This lesson on CCI buy signals explains precisely how to evaluate and understand buy triggers based on the Commodity Channel Index readings, as shown in the visual example below:
How Do You Analyze CCI Indicator Buy Trade Signal?
If the CCI is oversold, levels below? -100, then there is a pending market correction.
The oversold levels will remain intact until CCI starts and begins to move above? -100.
When price begins moving above? -100 then this is viewed as a buy signal.
Pair the CCI buy signal with a trend line break to confirm the buy.
How Do I Interpret CCI Indicator?
CCI How to Interpret/Analyze Trading Indicator Sell Signal
How Do I Analyze Sell Signal Using CCI Indicator?
Steps on how to analyze and interpret sell signals using CCI indicator:
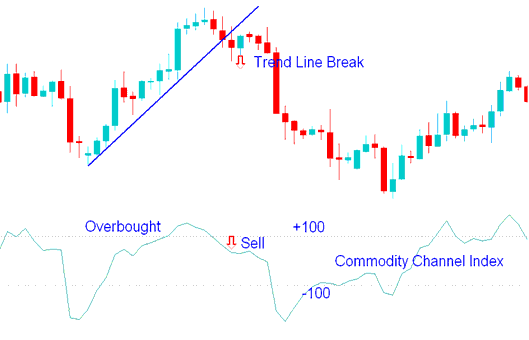
This lesson on CCI sell signals explains how to read and understand sell signals using the CCI, as it is presented and displayed in the example below:
How Do I Analyze CCI Sell Signals?
If the CCI is overbought, zones above +100, then there's a pending price correction.
CCI Stays in Overbought Until It Drops Below the +100 Level.
When price begins moving below +100 then this is viewed as a sell signal.
Confirmation of a sell signal generated by the CCI indicator necessitates its synergy with a signal derived from a trendline breach.
How Do I Interpret CCI Indicator?
How Do You Analyze CCI Indicator?
Get More Topics:
- How do you trade retracements in a downward trend?
- Trade with Ichimoku Cloud Indicator
- Executing Trades Following a Downward Trend-line Analysis within MetaTrader 4 Software
- How to Place XAUUSD Quotes in the MetaTrader 4 Android App
- How do you use the Demarker indicator for a buy forex signal?
- Can You Use MT5 Gold Software on a Mac?
- 3 Types of XAU USD Stochastic Oscillator, Fast, Slow and Full Stochastic Oscillators
- What Happens After a XAU/USD Reversal Doji Candlestick?
- Elliot Wave Theory for XAUUSD


