Pivot Points XAUUSD Analysis & Pivot Point Trading Signals
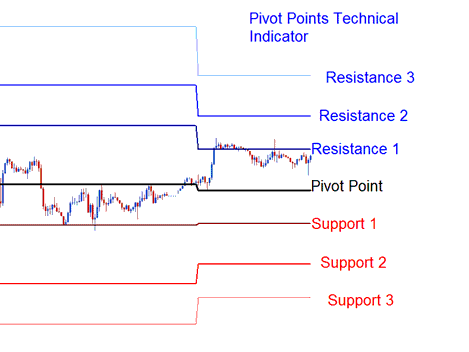
This signal shows a central point with three resistance levels underneath it and three support levels above it.
At first, traders used these points to study and trade stocks and futures. People think this indicator shows what is coming rather than what already happened.
Pivot points help Gold traders check the day's overall trend quickly. They use basic math to mark support and resistance levels.
To calculate these points for the coming trading day, the previous trading day's
- high,
- low, and
- close prices are used
The trading day closes and this daily final time is whilst the technical indicator is up to date.
The 24-hour cycle for this technical indicator are calculated using a complex formula. The center pivot point is then used to calculate the support and resistance levels as follows:
Resistance 3
Resistance 2
Resistance 1
Pivot Points
Support 1
Support 2
Support 3

Analysis and How to Generate Trading Signals
This tool can be used in different ways to make signals. The most used ways to study trading are listed below:
Gold Trend Identification Signals
Gold traders use the center pivot point to gauge the main price trend. All trades follow that trend direction.
- Buy signal - price is above the center pivot point
- Sell trading signal - price is below the central pivot point
Gold Price Break Out Signals
Gold Price breakout signals are derived/generated as follows
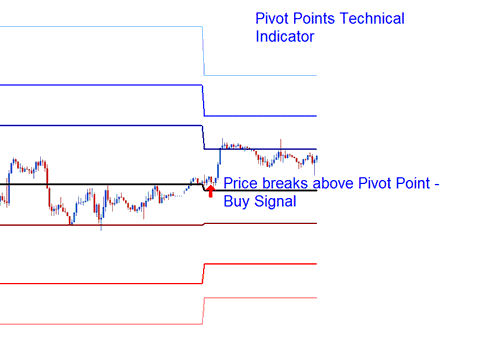
- Buy signal - gets derived and generated when the price breaks out upward through the central point.
- Sell signal - gets generated when price breaks-out downwards through the central point.

Gold Price Break Out
Gold Price Reversal Signal
Gold Price reversals are derived/generated as follows
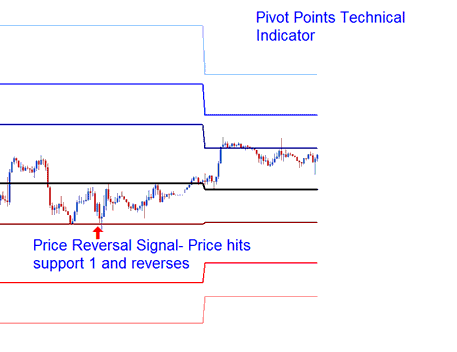
Buy Gold Signal- when the price moves down toward one of the support level, then touches support or moves & heads just slightly through it then quickly reverses and heads and moves upwards.
A sell signal occurs when the price approaches a resistance zone, either touches it or slightly breaches it, then quickly reverses direction and starts moving down.

Gold Price Reversal Trading Signal
Placing Stop loss and Limit Profit Values
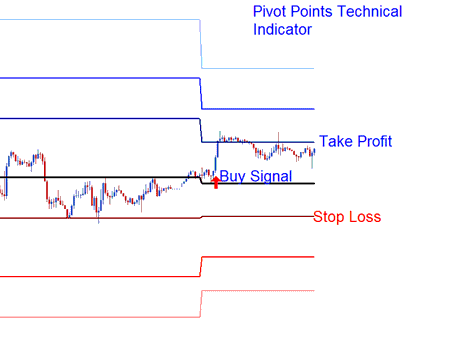
Gold traders use the center pivot and other support and resistance levels to set stop loss and limit profit orders. It helps them manage risk and lock in profits.

Placing Stop loss and Limit Profit
When placing a buy order above the central point, Resistance 1 or Resistance 2 serves as the take-profit level, while Support 1 is used as the Stop Loss order area.
To Download Pivot Points Indicator:
https://c.mql5.com/21/9/pro4x_pivot_lines.mq4
Upon downloading, open the file in MetaEditor using the MQ4 Language, then confirm the indicator's integration into your MT4 by pressing the Compile Button on the keyboard, and it will be added.
Note: When you add this indicator to MT4, it shows extra lines called Mid Points. To hide them, open the MQL4 editor with F4. Edit line 16 there.
Extern bool midpivots = true:
To
Extern bool mid-pivots = false:
Subsequently, select the Compile button once more, and the element will manifest precisely as shown on this webpage.
Learn More Topics & Courses:
- How do you add the Stochastic Oscillator for gold to a trading chart in MT4?
- How to Configure the Kase Peak Oscillator & Kase DevStop 2 Expert Advisor (EA)
- How Do You Set Inertia Indicator on Gold Chart?
- Best Leverage for XAU USD with $300
- How Do You Trade MetaTrader 4 Downward Channel on MetaTrader 4 Platform?
- Trading Analysis with Japanese Candle Patterns
- Active Trading Account for XAU USD
- How do you use the Zig Zag gold indicator on a chart?
- How do I load a MetaTrader 4 profile with XAUUSD charts?
- A Top XAU USD Broker for Scalping for Expert Advisor (EA) XAUUSD Bots and EA Traders

