
How to read DeMark Projected Range buy and sell signals.
DeMark Projected Range How to Interpret/Analyze Indicator Buy Signal
Interpreting Buy Trade Signals Generated by the DeMark Projected Range Indicator
Procedures for analyzing and interpreting buy signals generated by the DeMark Projected Range indicator:
This DeMark Projected Range indicator buy signal lesson gives an explanation of how to analyze and interpret buy signals using the DeMark Projected Range indicator as is displayed on illustration:
How Do You Interpret Buy Signals Using DeMark Projected Range Indicator?
DeMark Projected Range How to Interpret/Analyze Indicator Sell Signal
Interpreting Sell Signals from DeMark Projected Range Indicator
Steps for analyzing and interpreting sell trading signals using the DeMark Projected Range indicator:
This DeMark Projected Range indicator sell signal lesson gives an explanation of how to analyze and interpret sell signals using the DeMark Projected Range indicator as is displayed on illustration below:
How Do I Analyze Sell Signals Using DeMark Projected Range Indicator
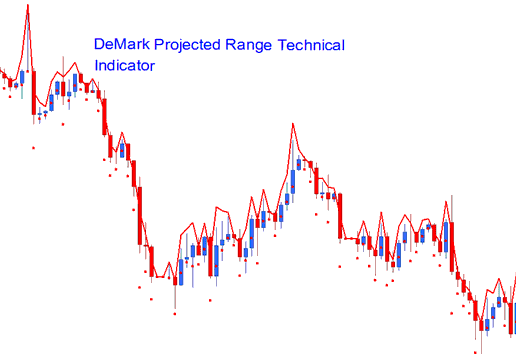
The DeMark Projected Range indicator helps predict potential price highs and lows where the chart's price is likely to move.
People call this a range projection. You figure it out by using the opening and closing prices from the latest price period.
How Do You Interpret DeMarks Projected Range Indicator?
FX Technical Analysis and Generating Signals
The DeMark Projected Range indicator will show 2 spots, which are the expected high and the expected low price for a certain time. These will be your guide.
Buy Upward Trend Signal
If the next price candle opens above the anticipated high, it suggests the market will continue its upward momentum.
Sell Downward Trend Signal
Should the subsequent price candlestick open below the anticipated low price point, this suggests that the market trajectory will continue in a downward direction.
Range Market
If the next price candle starts inside the range DeMark predicts, then this means the price will probably stay moving sideways in a range.
How Do I Interpret DeMark Projected Range Technical Indicator?
Study More Topics & Courses:
- Utilizing Support and Resistance Zones in Gold Trading Operations
- Understanding XAUUSD Sell Limit Orders
- Analyzing the Gold Box XAUUSD Pattern
- Strategies for Successfully Trading Support and Resistance Levels When Market is in an Upward Trend
- How to Spot When a Trendline Breaks: A Trading Signal Example
- How Can You Read Rising Wedge Pattern?
- Gold Market Opening Schedule
- Methodology for Plotting Fibonacci Expansion Levels on an Ascending Trend.
- How to Put Speeding Up Tool on Gold Graph on MetaTrader 4
- Analysis of XAUUSD Indicators for Gold