Continuation Patterns XAUUSD Trading Patterns
When these continuation chart patterns show up, they confirm that the current Gold price trend should keep going in the same direction it already was.
XAU/USD market participants utilize these specific continuation chart formations as tools to pinpoint the approximate midpoint of a prevailing trend, since these patterns characteristically materialize halfway through a market movement cycle.
The four kinds of continuation chart patterns are:
- Ascending triangle
- Descending triangle
- Bull flag/pennant
- Bear flag/pennant
Rising Triangle Continuation Chart Pattern
The ascending triangle chart formation takes shape within an upward trend, signaling the continuation of the market price's upward trajectory. It indicates the presence of a ceiling resistance level that buyers (bulls) are consistently pushing higher, and upon which a breach will lead to sustained upward price movement.
Overhead resistance stops the XAUUSD gold price from climbing for now. A trend line rising below shows buyers still active. Breaking above the upper line signals a buy for this breakout from an ascending triangle. This pattern appears in the gold price uptrend. The triangle acts as a pause that leads to more gains.
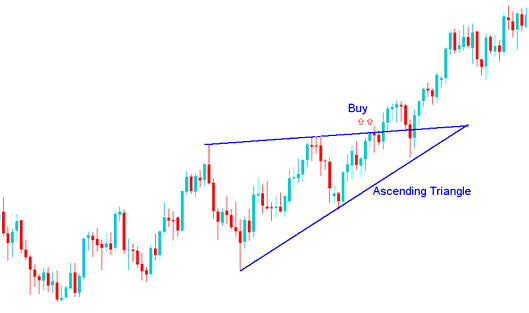
Rising Triangle as a Continuation Pattern
The market established an ascending triangle formation during its upward trajectory, which consequently led to an upward continuation. The optimal point to initiate a purchase is when the price decisively breaks above the upper sloped boundary, with the market maintaining its upward momentum afterward.
Falling Triangle Setup
The descending triangle appears in a downtrend, showing that the price is likely to keep going down. It shows there is a support level that sellers (bears) keep pushing lower, and when this support area breaks, the price will keep going down.
The support level temporarily halts the market from declining/falling, while the descending sloping line above the pattern setup signals that sellers(bears) are still present. A down side penetration of the lower line is a technical sell signal for a market breaking downwards from a descending triangle setup an indication that selling will follow.
The falling triangle pattern forms/develops as a consolidation period within the XAUUSD price downtrend, indicating that the downward trend will continue.
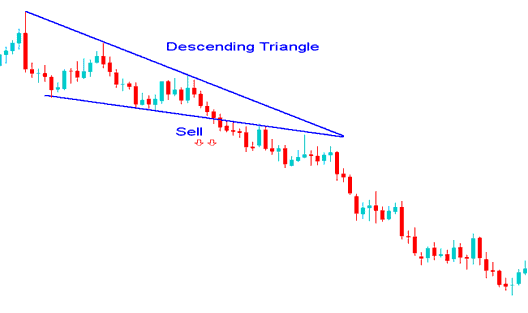
Falling Triangle Continuation Chart Pattern
The market built a descending triangle in its drop. This sparked more sales and kept the fall going. Sell signal hits when price cuts the bottom line. Pressure then drives it down further.
Bull Flag/Pennant
This setup forms a rectangle with parallel support and resistance. Price breaks out after trading inside. Flags often slope a bit.
The bull flag happens when the Gold price is generally going up. In this chart pattern, the price goes back a little, and it looks like a small pullback with prices not moving much and having a slight downward direction. You should buy when the price goes above the flag's top line. The flag part has high and low points that can be linked with tiny lines that run side by side, making it look like a small channel.
The pennant pattern happens halfway up a bullish trend, and after a break-out, a similar move to the height of the flag-pole is likely.
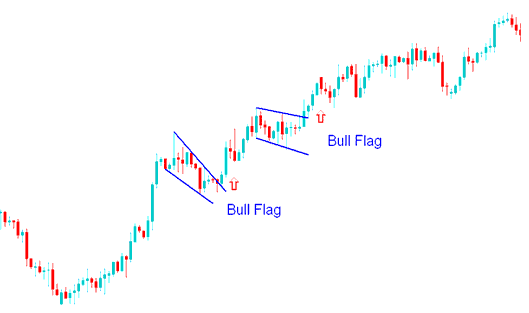
Bull Flag Pennant Continuation Chart Setup
The bull pennant above was a pause. The market built strength to break higher. The signal completed when price broke the upper line upward.
Bear Flag/Pennant Pattern
This bear flag appears in a downward XAUUSD price trend. It is a continuation pattern. Price pulls back a bit with tight action that tilts up slightly. Sell when price breaks below the flag's lower line. The flag part has highs and lows linked by parallel lines, like a small channel.
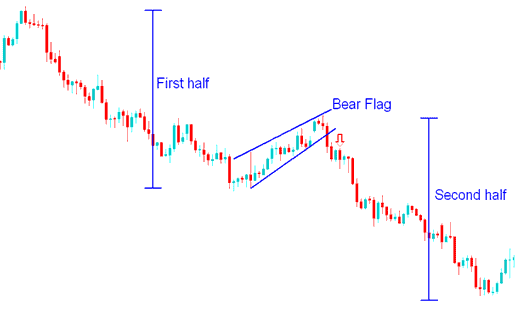
Bear Flag Pennant Setup
The bear flag pennant chart pattern mentioned earlier serves as a consolidation phase before further selling pressure emerges. The continuation signal is confirmed once the lower line breaks to the downside.
Access Further Subjects and Learning Materials:
- Setting up a trailing stop loss indicator on your trading chart
- RSI Swing Failure on Upwards & Downwards XAUUSD Trend Setup
- XAUUSD Basics
- XAUUSD News Trading Strategy
- Clarification: What Constitutes a Cent XAUUSD Account?
- How Do You Gold Set Buy Stop XAU USD Order on MetaTrader 5 Trade Software Platform?
- Bollinger Bands XAU USD Indicator Analysis
- Can I Trade XAUUSD With $5
- Draw Down vs Maximum Draw Down on XAU USD Account Described
- Developing Effective XAU USD Setups and Trading Strategies
