OBV and RSI and MA Cross-Over Gold Trading Best Strategy
This tutorial will provide an illustration of an optimal strategy that swing traders can employ to develop a profitable trading approach. Based on the widely used stocks trading strategy, where investors utilize volumes to forecast price movements, the principle "Volumes precede price" is applied. In the market, there is no central clearinghouse for volume aggregation: therefore, we utilize a technical indicator to estimate volumes. This indicator is known as On Balance Volume (OBV).
This indicator works together with RSI and MA Cross-Over Best Strategy to create a Best Trading Strategy for trading. The Indicator has these properties:
- 5 and 7 Linear Weighted Moving Average, Linear Weighted Moving Averages
- RSI 14
- OBV
Timeframe: H4 chart
Entry Signal
Buy
- Both Moving Average MA pointing up
- RSI above 50
- OBV is in an upwards trendline or it has broken downward trend line
Sell
- Both Moving Average MA pointing down
- RSI below 50
- OBV is in a downwards trend line or it has Broken upwards Trendline
Exit Trading Signal
OBV gold trend line is broken
The RSI yields a signal indicating movement contrary to the current market trajectory upon crossing the 50 central line.
You can learn more about writing a Trading Strategy rules Writing Best Method Rules and Generating Signals
You can also explore other Trading Strategies: A Listing of Strategies
How do you generate signals with this trading strategy?
Before we jump into the examples below - like the ones with 138 and 177 pips profit - you need to understand the idea that volume comes before price, and how the On Balance Volume indicator works.
The On Balance Volume indicator employs trading volume data to gauge the net flow of capital either entering or exiting the Gold market.
The OBV indicator sees its most frequent application in stock market analysis. The fundamental premise of OBV posits that Volume consistently precedes price action. When analyzing the trajectory of any financial instrument, be it a stock or another asset, comprehending the transactional volumes flowing into and out of gold is paramount. These volumes can be quantified in terms of monetary value: in Gold Trading, since charts are constructed based on tick data movements, greater volumes of money equate to more tick data. Therefore, in Gold Trading, volumes measure the sheer quantity of tick data actively participating in the gold market.
On Balance Volume leads by showing buy or sell pressure in gold. Volume moves before price, so it reveals investor mood.
For the Best Trading Strategy, the required indicators are worked out in a different way. As an example, our Best Trading Method is based on
RSI - momentum technical indicator
MA - direction based indicator
OBV - volume based indicator
A superior trading system, such as this, provides a consolidated view of market movement by integrating three distinct calculation methodologies, as opposed to relying on three oscillators that derive signals from the identical calculation formula.
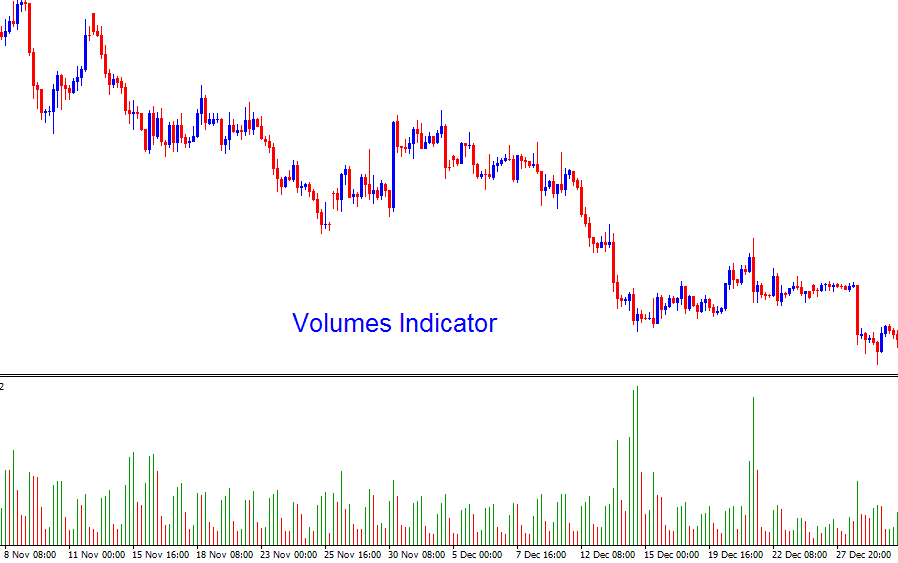
OBV, or On Balance Volume, tracks tick volume for each candle in a trade item. On a 1-hour chart, it adds up the volume for that hour. On daily charts, it totals the volume for the full day.

The volume indicator does not show volume direction. It uses colors to mark candles: green for bullish and red for bearish.
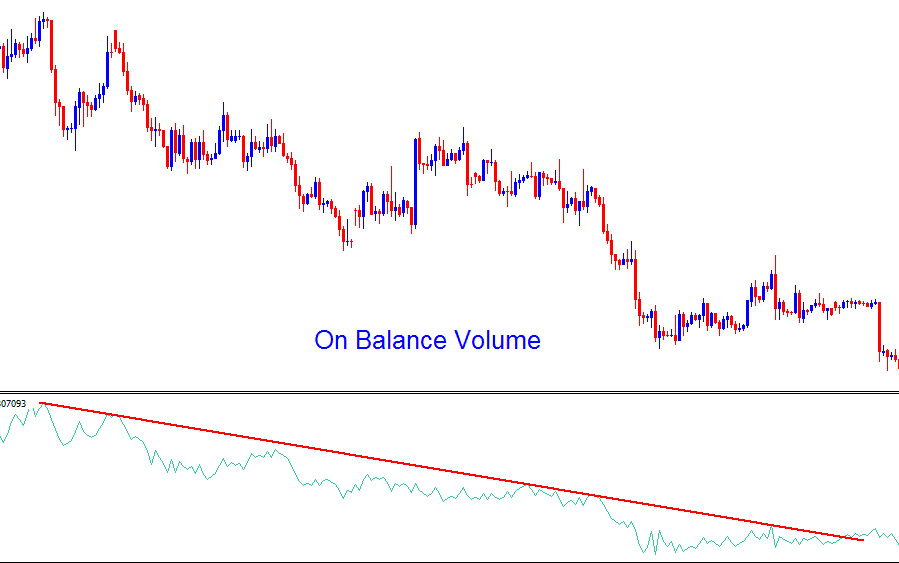
On Balance Volume gives direction to volume. It shows if volume flows into or out of gold.

Volume Precedes Price
Volume leads price action, making it a top early signal. Reading it well aids traders in guessing the next market turn.
When volume increases, it indicates that money is beginning to flow into gold. Since volume often precedes price movements, this typically leads to an increase in gold's value. A rising On-Balance Volume (OBV) shows more buyers are entering the market than sellers.
A decline in trading volume suggests that capital is beginning to exit the Gold market. Since volume movements typically precede price shifts, the subsequent action is usually a depreciation in Gold's valuation. A downward trajectory in OBV indicates that greater volume is being committed to short positions than to long ones.
Subsequently when a downward trend-line of the On Balance Volume is broken it shows that sellers are starting to take-profit order and close their orders.
Similarly, a break in the On Balance Volume indicator's upward trend line indicates that buyers are starting to liquidate their long holdings and collect their gains.
Because the On Balance Volume will add direction to the volume & form a general direction, one can compare and analyze the two, the price direction & the OBV direction. The direction of these 2 should correspond but when there is a disconnect between these two then a trader should pay attention to know when to exit the market or when to open a order.
On Balance Volume is a leading indicator and a trader using this technical indicator can avoid entering a market when it's too late. This Indicator is also a good indicator to illustrate when to take a profit early enough before the market takes away all your trading profit.
XAUUSD Indicator Formation
The On Balance Volume indicator reflects the cumulative effect of volume changes based on price direction.
Upwards direction - adds volume/ indicator moves upwards
Downwards direction - subtracts volume/ trading indicator moves upward
Sideways market/Range market - technical indicator heads Sideways
Due to the price's oscillating movement, the OBV technical trading indicator will also exhibit a zigzag characteristic.
XAUUSD Price Trend-Lines
Most Traders will use these to generate buy & sell signals.
For our Best Trading Plan, we'll use the OBV indicator to back up the buy and sell signs from price trend-lines.
We will chart a Trendline across both the price action and the indicator. A buy or sell action is warranted if both signals align directionally.
This strategy will be used to determine two things.
Continuation of ruling trend direction
Reversal of ruling market direction
Learn More Tutorials & Lessons:
- Any MT4 tutorial lessons for XAU/USD chart analysis?
- How to Place Choppiness Index Indicator on a Trade Chart?
- Drawing Trend Lines & Channels on XAUUSD Charts in MT4
- Gold 20 Pips a Day Method
- Spot Bullish and Bearish Divergence Trades for Gold
- OBV Breakout – XAU/USD System Indicator Explained
- Setting Up Entry Orders for Gold: Comparing a Buy Stop Gold Order Against a Sell Stop XAUUSD Order?
- Weekly XAU USD Chart Trading System
- Gold and Divergence Strategies: MetaTrader 4 & 5 Course Tutorial
- Various Chart Types for XAU/USD

