Hidden Bullish & Trade Hidden Bearish Divergence Trade
Gold traders use hidden divergence to spot trend continuation after a pullback. It signals the main trend resuming. This setup works well since it follows the ongoing market direction.
Gold Hidden Bullish Divergence Setup
This pattern shows price making a higher low, while the oscillator marks a lower low. Picture it as a W on the chart. It happens during pullbacks in uptrends.
The examples described and detailed below demonstrate a screen shot of this trading formation, the price in the screen shot made a higher low (HL) while the technical indicator made a lower low (LL), this indicates that the price and the indicator diverged. This signal indicates that the market uptrend is going to continue very soon. Essentially, it signifies that it was just a retracement in an upward trend.
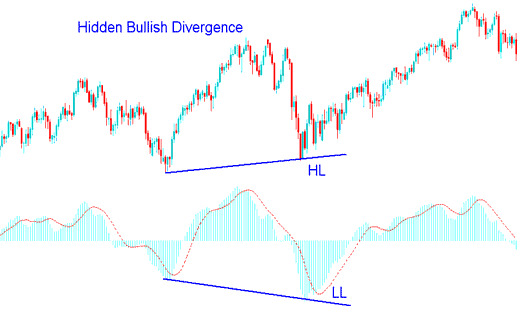
This setup confirms a pullback has ended. It also highlights the strength behind an uptrend.
XAU/USD Hidden Bearish Divergence Trade Setup
This happens when the price for trading is making a lower high (LH), but the technical oscillator shows a higher high (HH). To easily remember this, imagine M-shapes on the Charts. It appears when a downwards trend temporarily moves upwards.
The pictures shown and talked about below display a screenshot of this pattern, from the screenshot the price went to a lower high ( LH ) but the indicator went to a higher high ( HH ), this shows that there was a difference between what the price did and what the indicator did. This shows that soon the market will start going down again. Simply put, it shows this was only a small rise in a downwards trend.
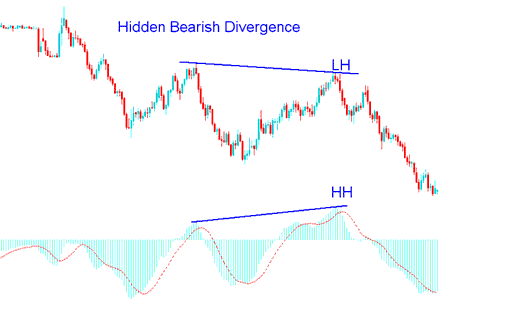
This confirms that a market price retracement move is complete and indicates the underlying momentum of a downwards trend.
Other popular indicators used are CCI trading indicator (Commodity Channel Index (CCI) Indicator), Stochastic Indicator, RSI and MACD. MACD & RSI Indicator are the best indicators.
Note: The hidden divergence pattern is considered the most effective type of divergence pattern for trading, as it signals a movement in the same direction as the prevailing market price trend. Consequently, this setup offers a high risk-to-reward ratio, providing the optimal entry point.
A XAUUSD trader should pair this setup with tools like stochastic or moving averages. Buy when gold is oversold, and sell when overbought.
Pair Hidden Divergence with Moving Average Crossovers
A helpful tool to use with these trade setups is the moving average, using the point where the moving averages cross. This will make a strong plan.
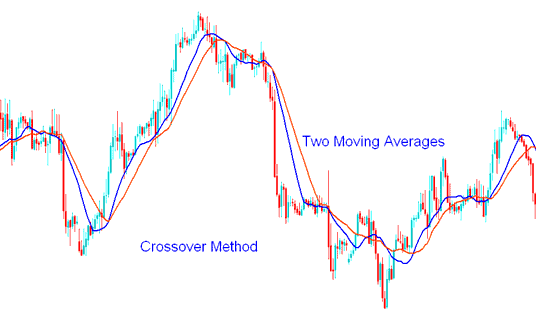
Moving Average Cross over Technique
With this way of doing things, after the signal to trade is given, a trader waits for the moving average cross over way of doing things to give a signal to buy or sell in the same direction: if there's a bullish difference between price and indicator, wait for the moving average cross over method to give a signal to go up, but if there's a bearish difference, wait for the moving average cross over trading strategy method to give a signal to go down.
By integrating this signal with other analytical tools in this manner, spurious signals (fake outs) during trading can be circumvented.
Combining Together with Fib Retracement Levels
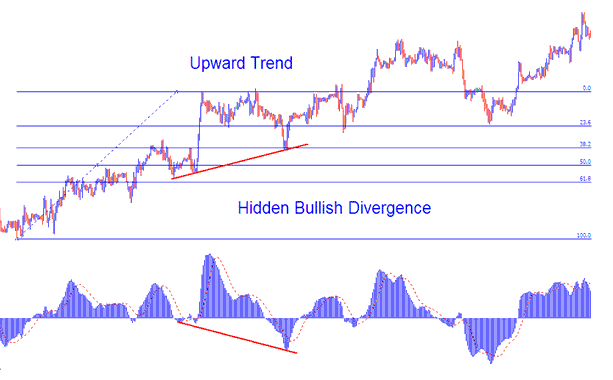
For this illustration, we will consider an upward trend and utilize the MACD indicator.
Because the hidden divergence setup is just a price retracement in an upwards trend we can combine this signal with most popular retracement tool that is the Fibonacci retracement levels. The example shown & explained below portrays that when this trading setup formed on the trading chart, price had just hit 38.20% level. When price tested this level, this would have been a good level to open a buy trade order.
Combining with Fibonacci Extension Levels
In the trading above example once the buy trade was placed, a trader would then need to calculate where to put take profit for this trade. To do this a gold trader would need to use the Gold Fibonacci Expansion Levels.
The Fib extension was drawn such as shown on the trading chart as cited below.
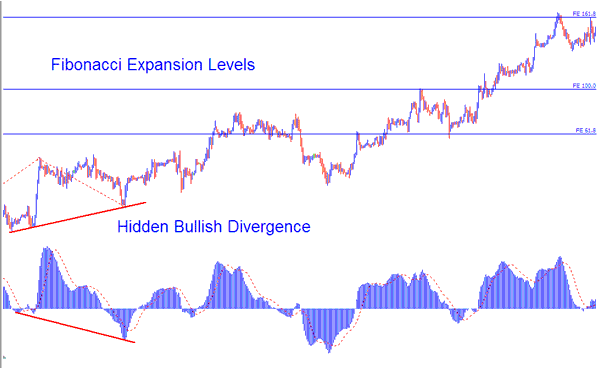
For this exemplification there were three take-profit levels:
Expansion Level 61.80% - 131 pips profit
Extension Level 100.00% - 212 pips profit
Expansion Level 161.80% - 337 pips profit
This plan, along with the Fibo indicator, could have been a solid plan with a good amount of profit from trading, set by using these levels to take profit.
More Tutorials and Lessons:
- Steps to Change a XAU/USD Take-Profit Order on the MT5 Trading Area
- MetaTrader 4 Guide to Recognizing Candle Patterns
- How to Open a Gold Account with a MetaTrader 4 Gold Broker
- Steps to put in and set up an XAUUSD order to wait in the MT5 platform.
- What is Lot Size in XAUUSD for Standard Lots?
- Understanding Draw-down and Maximum Draw-down
- Learn Getting Started in Tutorial
- Practicing Fibonacci Expansion Chart Levels Compared to Practicing Fibonacci Retracement XAU USD Chart Levels
- Steps for Trading with the Commodity Channel Index Indicator
- How to Place Stop-Loss Orders for XAU/USD in MetaTrader 4
