RSI Trading Strategies
- RSI Levels Indicating Over-bought and Over-sold Conditions
- RSI Divergence Trading Setups
- RSI: How to Spot Classic Bullish and Bearish Divergence
- Identifying Hidden Bullish & Bearish Divergence in RSI
- Methodology for Swing Failure Strategy
- RSI Patterns Gold Trend lines
- RSI Summary Overview
RSI Indicator Strategy
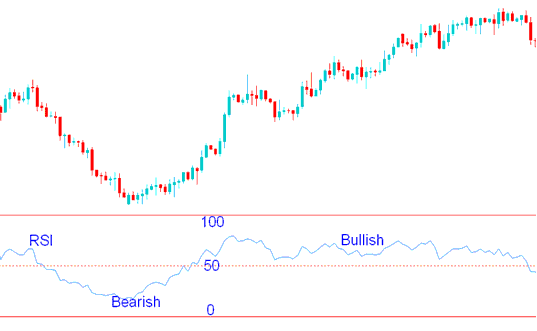
RSI or RSI is one of the most popular indicator used in gold trading. It's an oscillator which oscillates between 0 -100. This is a market trend following indicator. It indicates the power of the market trend, values above 50 reflect a bullish trend while values below 50 show bearish market trend.
RSI Indicator Measures Momentum of a Trend.
The middle line for the RSI is at 50: when it crosses, it means the trend is changing from going up to going down, or the reverse.
When it is above 50, buyers are stronger than sellers, and the price on the chart will keep going up as long as the RSI stays above 50.
When it's below 50, sellers are stronger than buyers, and the price on the chart will keep going down as long as RSI stays below 50.

RSI Indicator - How to Trade Gold with RSI Indicator
In the picture shown above, the price consistently went down when the technical indicator was below 50. As long as the RSI stayed below 50, the price kept going down. When the RSI went above 50, it showed that the selling force had switched to buying, and the downwards trend was over.
When the RSI moved to above 50 the price started to move upward and the trend changed from bearish to bullish. The chart price continued to move upwards and the RSI remained above 50 afterwards.
Looking at the preceding illustration, during bullish market periods, the RSI occasionally moved downwards but consistently remained above the crucial 50 midline mark. This behavior signifies that these downward movements are merely temporary fluctuations or price pullbacks, as the overall market price trend maintained its upward momentum throughout these instances. As long as the RSI does not drop beneath the 50 level, the dominant trend is considered unbroken. This is the fundamental reason the 50 centerline is utilized to differentiate between bullish and bearish trading signals.
The RSI typically uses a default 14-day period as recommended by its creator J. Welles Wilder. However, traders may also use alternative timeframes such as the 9-day or 25-day periods based on their strategies.
RSI periods match your gold chart timeframe. A daily chart makes 14 periods equal 14 days. An H1 chart makes them 14 hours. Our example uses a 14-day average. Swap the days for your trading timeframe.
To Calculate RSI Indicator:
- The No. of days that a market is up compared & analyzed to the No. of days that the market is down in a particular given period of time.
- The numerator in the basic formula is an average of all the gold sessions that finished with an upward price change.
- The denominator is an average of all the down gold sessions closes for that period.
- The average for the downward days are calculated as absolute numbers.
- The Initial RSI is then turned in to an oscillator trading indicator.
Sharp upward or downward price movements during single gold trading sessions may distort RSI calculations and result in false signals - a spike signaling a fake-out scenario.
RSI Center Line: The centerline for this indicator is 50. A value above 50 implies that the price trend is in a bullish phase as the average gains are higher than average losses. Indicator Values below 50 indicate a bearish market phase in the & signals that the prices are generally closing lower than where they opened.
Wilder set the overbought and oversold levels for the RSI at 70 and 30, indicating when market movements are excessively extended.
Learn More Topics:
- Various Chart Types for XAU/USD
- Analysis of the Chandes Dynamic Momentum Index trading indicator buy and sell signals
- Chaikin's Money Flow - XAU/USD Indicator Analysis
- Identification of Classic Bullish Divergence on MACD and Bearish Divergence on Gold Indicators
- Gold 20 Pips a Day Strategy
- MT5 Gold Software Platform
- How do you use the Balance of Power (BOP) indicator?
- What is the Best Way to Trade MACD?
- Can You Start XAU/USD with $1000 for Standard Gold Account?
- Descriptions of Various Free Gold Trading Indicators Available
