
How to Draw Crude Oil Fibo Retracement Levels Technical Indicator on MetaTrader 4 Platform
Crude Oil Fibo Retracement Trading Indicator
To calculate these crude trading price pullbacks on the crude oil chart for example the MT4 we use Fibonacci retracement levels tool/indicator as shown on the image below.
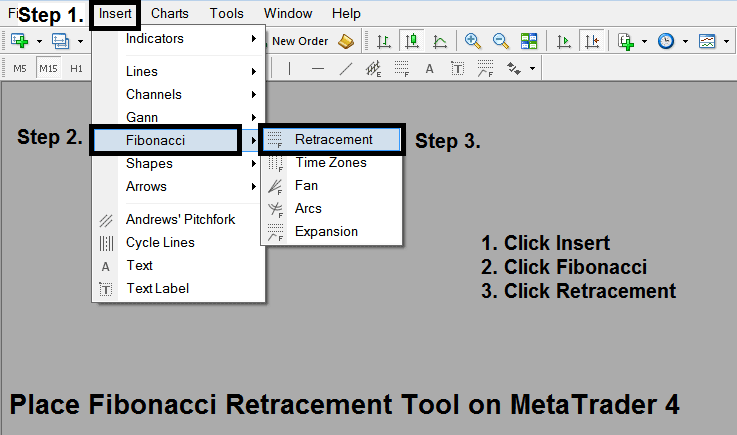
If you want to analyze some oil charts using this Fibonacci retracement line studies tool, it is already provided for in the MT4 platform, the following procedure is used to add this Fibonacci retracement tool on the MT4 Software. On The MT4 platform this fibonacci retracement tool will automatically draw the retracement levels on a oil chart once it is placed on the Oil chart.
To add this fibonacci retracement indicator in the MT4 software, you can use the following short cut method:
1. Click Insert 2. Click Fib 3. Click Retracement
After adding this fibonacci retracement tool on the MT4 platform this fibonacci retracement oil technical indicator can then be accessed from 'MT4 Line Studies Tool Bar' as shown below.
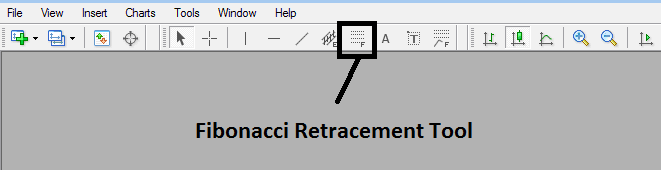
This fibonacci retracement tool is located on MT4 (Line Studies Toolbar), to go to this MT4 Line Studies tool bar click 'View' button at the tops left corner of MT4 next to file, then click 'Toolbars', Then Check 'Line Studies'. You can learn how to use MT4 Line Studies Tool Bar on the MT4 platform using a practice account.
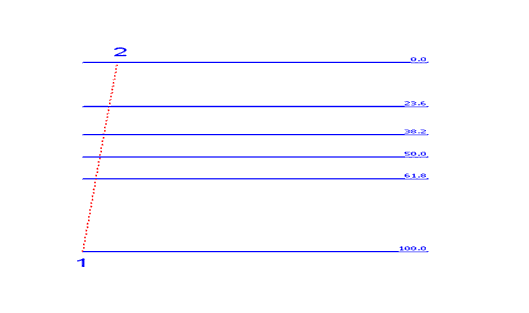
Shown Below is example of the Fibonacci retracement tool, we always draw the fibonacci retracement indicator between two chart points, point 1 and point 2, in the direction of the oil trend as shown below.
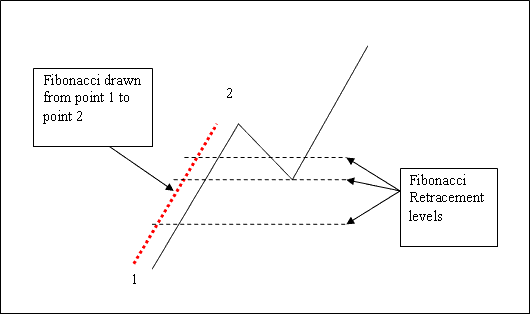
How to Place Crude Oil Trading Fibonacci Retracement on a Oil Trading Chart
To Place this fibonacci retracement tool on a oil chart, click on the button shown above on the MT4 software. Then select 2 chart points, the first point is where the oil trend starts and the second point is where the oil trend pull back is starting.


