How Do I Trade Hidden Bullish and Hidden Bearish Divergence
Trading using hidden divergence is used as a possible sign that a price trend will keep going after the price has moved back a bit. It's a sign that the original XAUUSD trend is starting up again. This is the best divergence setup to trade because its market sign is in the same direction as the trend that is continuing.
Hidden Bullish Divergence
This subtle instance of bullish divergence occurs when the price generates a persistently higher low (HL), yet the corresponding trading indicator registers a lower low (LL). An easy way to visually recall this is by picturing W-shapes on the price charts.
A hidden divergence signal manifests during a period where the price of gold is retracing within an upward trajectory.
The exemplification laid-out below shows this setup - from the screen-shot the price made a higher low (HL) but the trading indicator made a lower low (LL), this shows that there was a hidden divergence trading signal between the Gold price & the indicator. This hidden divergence trade signal shows that soon the market upward trend is going to resume. In other words it shows this was just a retracement in an upward trend.
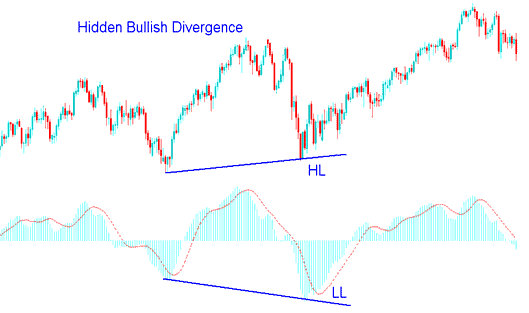
Hidden Bullish Divergence Signal - Gold Chart
This hidden bullish divergence signal shows that the pullback is done and shows how strong an upward trend really is.
Hidden Bearish Divergence Trading Setup
Hidden bearish divergence trading pattern occurs when price is making a lower high (LH), but the indicator is showing a higher high (HH). To remember easily think of and consider them as M shapes on price charts.
After establishing your new trade positions, use the TP Bitcoin Order Window located above to designate the Take Profit level for the new order.
The example shown below displays the hidden divergence trading pattern: in this example, the XAUUSD Gold price reached a lower high (LH), but the indicator reached a higher high (HH), showing a difference between the Gold price and the indicator. This indicates that the market's downward direction will soon start again. In other words, it shows that this was simply a small rise in a downward trend.
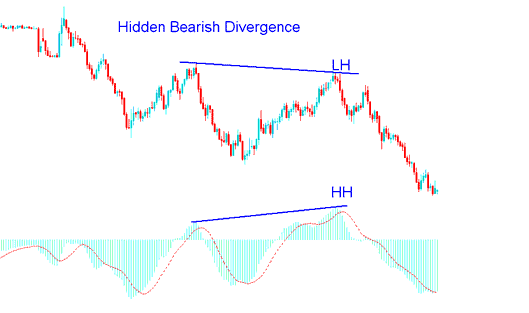
Hidden Bearish Divergence Setup Signal - XAU/USD Chart
This hidden divergence trading setup pattern confirms that a retracement move is complete and reflects under-lying strength of a downwards trend.Other popular indicators used are Commodity Channel Index(CCI) trading indicator, Stochastic Oscillator Indicator, RSI & MACD. MACD and RSI are the best indicators.
NB: Hidden divergence trading pattern is the best type of divergence signal to trade because it generates a trade signal that is in the same direction with the current trend, thus it has got a high risk reward ratio - because it provides for the best possible entry for opening a trade.
Still, a gold trader should use this trading method together with another tool such as the stochastic oscillator or moving average crossover method, and they should buy when the tool shows that the gold price is too low and the price is rising, and sell when the tool shows the gold price is too high and the price is falling.
Hidden Divergence Plus MA Cross - Combo Trade Method
The Moving Average MA indicator, which employs the moving average cross over trading strategy approach, is a solid tool for integrating these underlying divergence trading configurations. This will result in an effective plan for identifying trading signals and verifying them before making any trades.
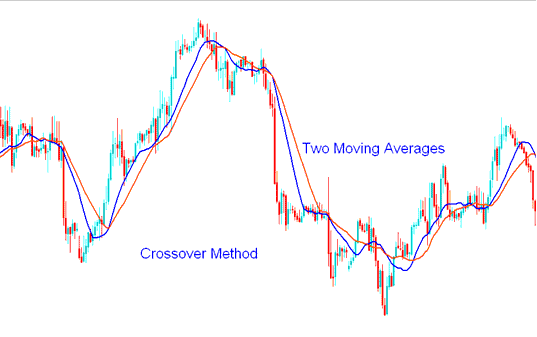
Moving Average Cross-over Method - Gold Trading Strategies
In this trading approach, after receiving a divergence signal, an XAU/USD trader will wait for the moving average (MA) crossover strategy to provide a buy or sell signal aligned with the direction of that divergence.
- If there is a bullish divergence trading pattern between the price and indicator, wait for the moving average crossover method to give an upwards cross-over signal before opening a buy position.
- While for a bearish divergence trading setup pattern wait for the moving average crossover method to give a downwards bearish cross over signal before opening a sell trade.
By integrating this concealed divergence trading configuration with supplementary trading indicators in this manner, a trader can effectively sidestep false signals when dealing with XAUUSD Gold via this divergence method.
Pair Hidden Divergence with Fibonacci Retracement Lines
For this example we shall use an upwards market trend. We shall use the MACD.
Since the hidden divergence trading pattern indicates that the current price movement is merely a retracement in an uptrend, this divergence signal can be effectively combined with the popular Fibonacci retracement tool.
The demonstration below highlights how the hidden divergence trading setup appeared on the gold price chart right after it reached the 38.2% Fibonacci retracement level. When the price tested this level, it presented an excellent opportunity to initiate a buy trade.
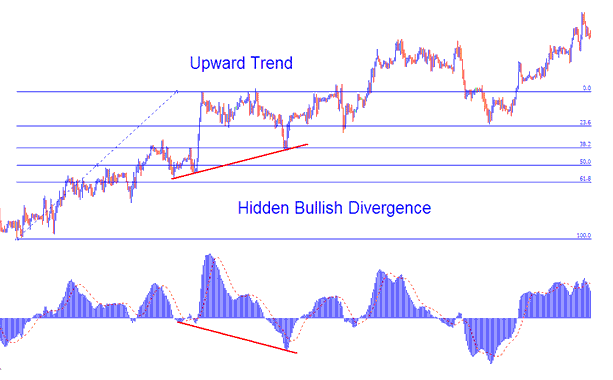
Integrating Signals from Hidden Divergence with Fibonacci Retracement Levels for Enhanced Analysis.
Integrating Hidden Divergence Setup Signals with Fibonacci Extension Levels
In this buy trade example, a gold trader sets the take profit level. They use Fibonacci expansion tools to find the spot on XAUUSD.
The Fib extension levels were drawn on price chart like is shown below.
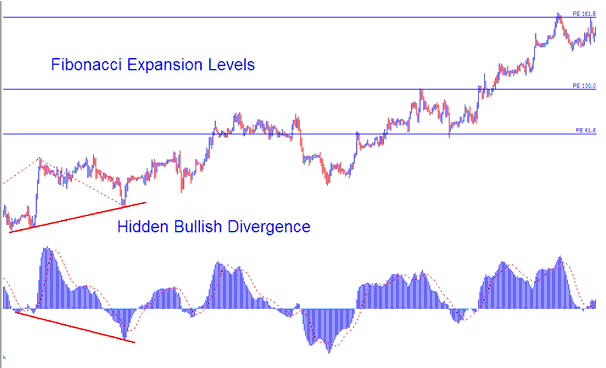
Combining Hidden Divergence Signal with Fibonacci Extension Levels
For this example there were 3 take profit order levels:
- Fibonacci Expansion Level 61.8 %
- Fibonacci Expansion Level 100.0 %
- Fibonacci Expansion Level 161.8 %
Applying a hidden divergence strategy along with Fibonacci tools could create an effective trading plan. It optimizes profits using Fib extension levels as predefined take-profit targets.
Examine More Topics & Courses:
- Identifying Key XAUUSD Patterns Recommended for Successful XAUUSD Day Trading
- How to Draw XAUUSD Trend-line in XAUUSD Chart
- XAUUSD Price Moves with MAs Gold Indicator
- What Is a Standard XAUUSD & Micro Account?
- How to Mark XAUUSD Trend-line on XAUUSD Chart
- Adding More Trade Charts on MetaTrader 4 Platform
- Fibonacci Extension XAU USD Chart Levels Exercise vs Fibonacci Pullback XAU USD Chart Levels Exercises
- XAUUSD Software Platform MetaTrader 4 Data Window Guide Lesson
- MetaTrader 4 MetaEditor Guide for How to Add EA Expert Advisors
