
Trend-Line Break - Trading Trend Line Reversal Signals
When the price of XAUUSD has consistently moved in a specific direction for an extended period within a channel, it eventually reaches a point where it ceases to move within that channel. At this juncture, we state that the trendline has been breached.
Trendlines serve as support or resistance levels. A break sends price the other way against the trend. That old boundary no longer holds the price. Traders then shut down their buy or sell orders. They lock in gains this way.
Uptrend Reversal - Upwards Trend-Line Break
When the market price breaches an ascending line (a support level), the subsequent behavior will typically involve a downward drift or a period of stagnation at that technical level before continuing the decline.
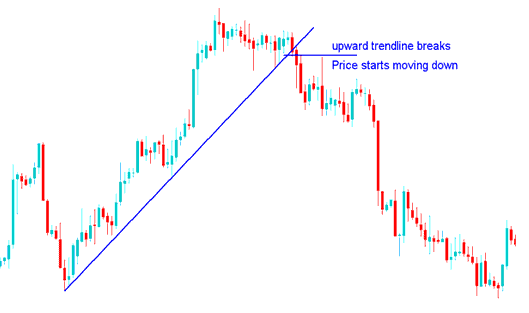
Upward Trendline Break
The creation of a lower high or a lower low, as in the double top chart pattern, is seen as the conclusion of this reversal signal. Additionally, this gives online traders looking to sell Gold metal the chance to short the market after the trendline is breached.
Downtrend Reversal - Downward Trendline Break
If price drops below the resistance line, the market often climbs or pauses at that key spot before rising again.
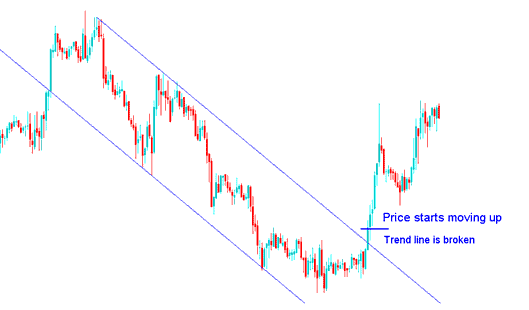
Downward Trendline Break
This reversal signal is considered to be complete with the formation of a higher low or higher high - double bottom chart pattern. This also provides an opportunity for traders who want to buy to go long once the trendline is broken.
Note: At times, when price snaps a market trend, it might pause and consolidate before shifting the other way. In any case, grab profits as soon as the market turns around.
To trade this trend-line reversal setup as a trader once you open a new trade in the direction of trend reversal price should immediately move in that market direction, in a price break-out manner. This means that the market should immediately move in that direction without much of a resistance.
Conversely, if the market fails to advance immediately in the direction indicated by the price breakout, it is prudent to close the position, as this suggests the prevailing market trend remains firmly in control.
An additional piece of advice involves waiting for the trend line to be decisively broken, with the market closing clearly above or below it to validate this signal.
Many traders bet on reversals before trends end. Price often hits the line, but the trend holds, and gold prices keep moving in the same direction.
When trading a trend-line break reversal setup, it is advisable to wait until the breakout is confirmed. This confirmation occurs when the price closes either above or below the trend line, depending on the market's direction.
- Upwards Market Direction Reversal - this signal is confirmed once the market closes below this upward trendline, this should be the correct time to open a short sell trade, so as to avoid a whipsaw.
- Downward Market Direction Reversal - this signal is confirmed once the market closes above the downward trend line, this should be the correct time to open a buy long trade, so as to avoid a whipsaw.
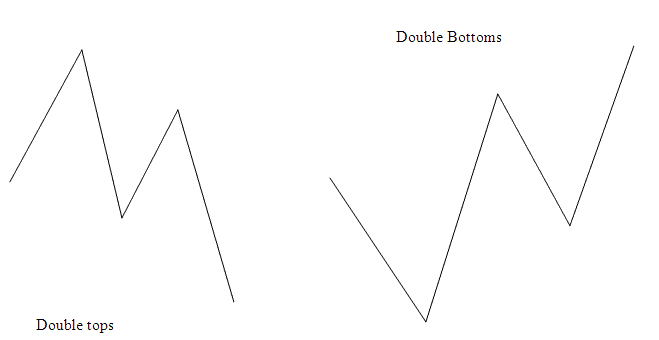
Combining with Double Top or Double Bottoms Patterns
A good trade plan to use with this trendline reversal plan is the double tops and double bottom chart patterns that appear on the charts.
This double tops and double bottoms chart reversal pattern should already have formed before the market trend break signal. Because these double top and double bottom are also trend reversal setups, then combining these 2 setups will give XAU/USD traders a good probability of avoiding whipsaw fakeouts.
In the chart examples above, you can see double tops and double bottoms forming - even before the reversal actually happens.
First example of an upward reversal: the double tops pattern was already in place before the reversal setup showed up on the gold price chart.
Second Example of Downward Direction Reversal - the Double bottoms pattern had already formed before the market trend break reversal setup appeared on the Gold metal trading chart.
Double Top or Double Bottoms Combined Together with other Trend Reversal Signals
More Guides & Lessons:
- MT4 William Percent R XAU/USD Indicator Analysis
- Types of Gold Bar Charts & Types of Bar Charts in XAUUSD
- Signals From Over-bought and Oversold Levels in XAUUSD Systems
- Configuration of Grid, Volume, Auto Scroll, and Chart Shift Features on MT4 XAU/USD
- Trade Gold and Guidelines in Accounts Equity Management Rules
- How to Trade SMA Indicator Buy FX Signal
- XAUUSD Software Workspace
- Adding the XAU USD Symbol to the MT4 Application for Android Devices
- Best Book on XAUUSD
- Drawing Downward Channels for XAUUSD on MetaTrader 4 Software