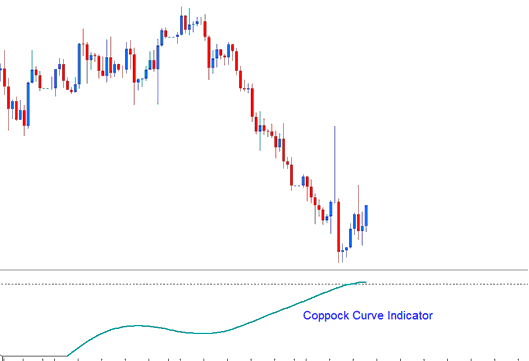
Coppock Curve Trading Analysis & Coppock Curve Trade Signals
Created by Edwin Sedgwick Coppock.
This indicator was used for technical analysis of Stocks & Commodities in the starting but was later used to trade Gold.

It comes from trading psychology. Human actions repeat. Prices move in a zigzag pattern.
Adaptation levels mean that prices react in certain ways at specific levels: stocks and prices will react in similar ways or create patterns like those we have seen in the past.
Analysis & Generating Signals
In trading, the moving average is a basic trend line. Price swings around it. This indicator builds on that. It acts as a long-term oscillator tied to the moving average, but used differently.
Oscillators often calculate the percent change from a current price to a past one. That past price serves as the reference point, like adaptation levels.
Edwin Coppock, when conceptualizing this technical gauge, posited that the prevailing emotional sentiment of market participants could be gauged and numerically represented by aggregating the percentage price fluctuations over a recent period to derive an overall estimation of the market's long-range momentum.
Basic signals can be generated with the Coppock Curve for trading price reversals at extreme levels, and traders may look for divergences and trend-line breaks to confirm signals.
Implementation
You might have to change the settings of this indicator to make it work better with the way the market is moving at the moment.
Coppock Curve has a zero mark as a reference, but it does not show the adjustment levels: it is only there as a visual guide.
Obtain Further Instructional Material & Programs:
- Different Ways to Manage Money in Gold XAU/USD Trading
- Balance of Power BOP XAU/USD Indicator, BOP XAU/USD Analysis
- How to Trade MetaTrader 5 Upward Gold Channel on MT5 Platform Software
- Available Platforms and Broker Accounts for Gold (XAUUSD) Trading.
- How Can I Modify Take-Profit XAU/USD Order MT4 XAU/USD?
- Previous Day Close Break Out XAU USD Strategy & Market Open Gold Strategies
- XAU USD Platform/Software MT5 XAU USD Line Studies Toolbar Menu
- MT5 XAU USD Platform App
- How to Analyze/Interpret Average True Range Forex Indicator
- How to Add Trading Bollinger Bands Indicator in Trading Chart

