How Do You Interpret Descending Triangle Chart Pattern Technical Analysis?
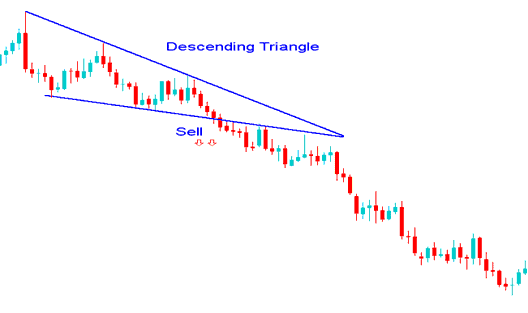
A Descending triangle pattern is a bearish continuation pattern - This is a market signal which shows the current gold trend is taking a pause before resuming the current downwards direction of gold.
If the Descending triangle downward continuation pattern forms it trading signals which the xauusd market is taking a pause before resuming the current downwards trend. Descending triangle continuation pattern in a downwards trend is known as a falling wedge which signals that the xauusd price is consolidation but keeps moving lower & lower forming a xauusd pattern that looks like a falling wedge. Traders should wait for a confirmation of this Descending triangle pattern before opening a trade based on this bearish continuation chart pattern. Once there is a xauusd price break-out to the down side then the Descending triangle continuation chart pattern is confirmed & xauusd prices will then continue to move in the direction of the current downwards xauusd price trend.