How Do I Interpret Market Trends?
To read a stock market trend you need to first of all learn what is a stock trend & how you can spot a stock trend on a stock price chart.
The first thing which you need to know about stock is that is the general direction of stock prices either upward or downward. The stock trend is the study & analysis of stock price movement upwards or downward.
Stock prices generally move within what's referred to as a stock trend. Stock price movement can either move in a downwards trend direction or an upwards trend direction.
To study stock trends - traders use stock trendlines to show the general direction of the stock trend.
A stock trend can be upward -therefore stock traders will draw an upward stock trend line on the stock chart
A stock trend can be downward -therefore stock traders will draw a downward stock trend line on the stock chart
An upwards stock trendline is a diagonal sloping line which slopes upwards thus its name - upwards stock trend line
An downwards stock trendline is a diagonal sloping line which slopes downwards thus its name - downward stock trend line
Guidelines for Drawing a Stock Trend Line
To draw a stock trend line - traders will need to follow the principles for drawing a stock trendline
At least two charts points are needed to draw a stock trend line - when the third point touches the stock trend line without going through the stock trend line then the stock trend-line is then considered as valid.
The direction of the stock trend line either upward or downwards will define the direction of the stock trend - the direction can either be upwards stock trend line or downward stock trend line.
Stock prices should move within this stock trend line & stock prices should not go past the stock trend line. As long as stock price is within the stock trend line then the stock trend is still intact.
The stock trading prices should move along the direction of the stock trend until such a time when the stock trend line is broken. Once the stock trend line is broken then stock traders will analyze this as a possible stock trend reversal signal because stock prices are not moving along the support zones or resistance areas provided by the stock trend line & thus this might mean that the stock trend is no longer holding.
Drawing an Upward Stock Trend Line
When the stock price moves upward it forms higher highs and higher lows forming an upwards stock price movement. An upwards stock trendline can then be plotted by connecting these stock price higher lows.
To draw this upwards stock trend line - we use support levels. To plot the upwards stock trend line correctly two support levels are needed.
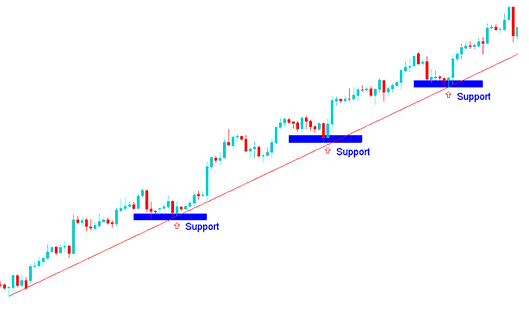
How Do You Interpret An Upward Stock Trend Line? - How Do I Analyze Stocks Chart Trends? - How Do I Analyze Stock Price Trends?
Drawing a Downwards Stock Trend Line
When it comes to learning how to draw & learning stock technical analysis of stock charts, you need to know that when the stock price is moving it forms lower lows and lower highs forming a downward stock price direction. These are the points that are used to draw the downward stock trend line.
To draw this stock downward trend - we use resistance levels and to draw a downward stock trend correctly two resistances are needed.
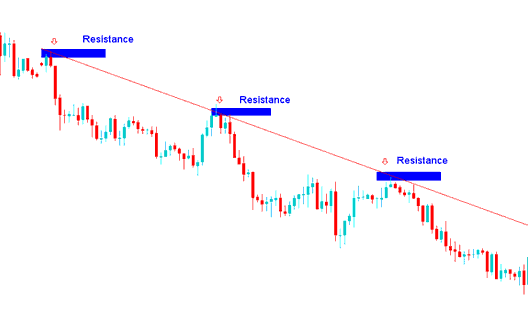
How Do You Interpret A Downward Stock Trend Line
How Do You Interpret Market Trends? - How Do I Analyze Stock Market Trends? - How Do I Analyze Stocks Chart Trends? - How Do I Analyze Stock Price Trends?


