MACD Stock Trading Strategies
- MACD Fast Line and Signal Line
- MACD Buy & Sell Trading Signals
- MACD Whipsaws Fake Out Signals
- Generating Center Line Crossover Signals
- MACD Classic Bullish & Bearish Divergence
- MACD Hidden Bullish & Bearish Divergence
- MACD Summary
Bullish & Bearish Trading Signals
The MACD indicator is one of the most widely & oftenly used stock technical indicators available. MACD technical indicator is a momentum oscillator with some stock trend following characteristics.
MACD technical indicator is one of the most popular indicators used in stocks trading analysis. MACD indicator is used to generate stocks signals using crossovers.
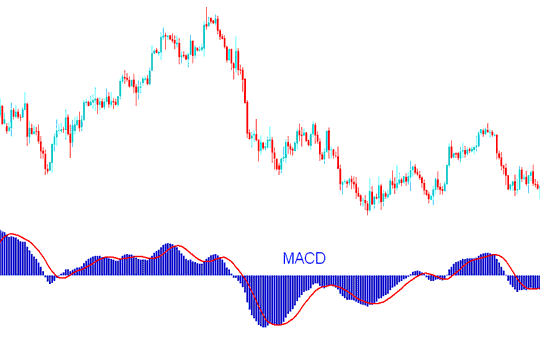
MACD plots the divergence and convergence of moving averages. MACD indicator is constructed using moving average analysis. Moving Average Convergence/Divergence is a trend-following stock indicator. MACD indicator shows the correlation between two moving averages.
One moving average is of a shorter period and the other for a longer period of stock trading price bars.
MACD Stocks Indicator - MACD Stocks Technical Indicator Technical Analysis
MACD indicator has a zero center line: values above zero line are bullish while those below zero are bearish.
In an upwards stock trend the shorter MACD line rises faster that the longer MACD line this creates a gap. In addition as long as the MACD indicator is above the center mark the stock trend is still bullish as shown below.
Do not sell as long as the MACD Stock Trading Indicator is above the Center Mark - this is bullish territory and it does not matter how it is moving as long as it is above the zero center mark, as shown on the stocks examples illustrated & described below.
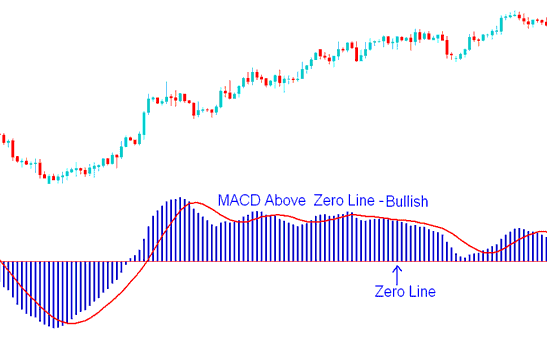
MACD Stock Trading Indicator Above Zero Mark - Bullish Trading Signal
In a downward stock trend the shorter MACD line falls faster than the longer MACD line this creates a gap. In addition as long as the indicator is below the center mark the stock trend is still bearish as shown below.
Do not buy as long as the MACD Stock Trading Indicator is below the Center Mark - this is bearish territory and it does not matter how it is moving as long as it is below the zero center mark, as shown on the stocks examples illustrated & described below.
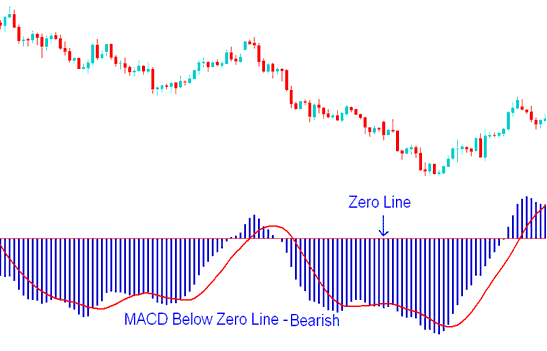
MACD Stock Trading Indicator Below Zero Center Line Mark - Bearish Trading Signal
When the stock trend is about to reverse the MACD lines begin to move closer to each other, thus closing the gap.


