Stochastic Oscillator Strategy
- 3 Types of Stochastic Oscillators
- How Stochastic Oscillator Works
- Oscillator Overbought and Oversold Levels
- Technical Analysis of Stochastic Oscillator
- Stochastic Crossover Signals
- Stochastic Oscillator Divergence Signals
- Stochastics Stock Trading System
Stochastic Strategy
Stochastic Oscillator indicator is an oscillation indicator that measures momentum of stock.
Stochastic Oscillator indicator is based on the idea that in an upward stock trend stocks price action tends to close at the high of the stocks price candlestick and during a downward stock trend stocks price action tends to close at the low of the stocks price candle.
Stochastic Oscillator technical indicator shows the strength of the current stock market trends and it shows regions of oversold and overbought levels.
Stochastic Oscillator indicator is one of the most oftenly used technical stock indicator, many Stock traders act on stochastic signals hence the stock signals of this indicator become self predicting.
Stochastic Oscillator indicator is used to identify certain stocks chart patterns, such as divergences.
Stochastic Oscillator indicator can give very early predictions of stocks price activity, thus Stochastic Oscillator indicator is a Leading stock indicator.
Stochastic Oscillator indicator gives more stock trading signals than other main momentum indicators, and these momentum stock indicators should be used together with other technical stock technical indicators.
Stochastic Oscillator indicator is comprised of two lines one called the fast line & the other slow line. These two lines move in direction of the Stock trend.
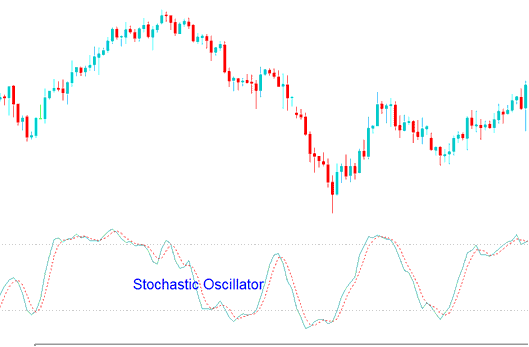
Stochastic Oscillator Stocks Indicator - Stochastic Oscillator Strategy


