Stock Trend Trading Indicators
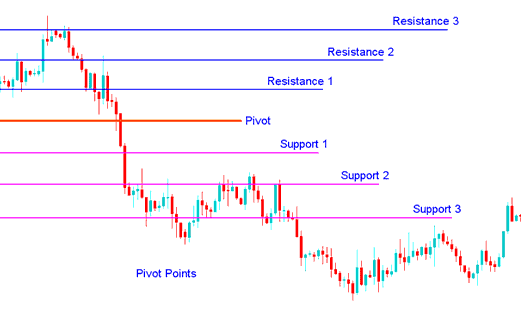
Pivot Points are used by stocks traders to find support and resistance levels based on the previous day's stock trading price action.
This stock indicator is a very useful tool that use the previous bars' highs, lows & closings to project support & resistance levels for future bars.
This stock indicator provides an idea of where key support and resistance should be. Place the pivot points on your stocks charts and stocks price will bounce off one of these levels. These levels are used by stocks traders to determine market tops, market bottoms or stock trend reversals.
- Daily pivots points are calculated from previous trading day's high, low, close
This stock indicator is shown below
Technical Analysis in Stocks Trading
The central pivot itself is the primary level, which is used to determine the trend
The other support & resistance levels are also important in calculating areas that can generate significant market movements.
This stock indicator can be used in two ways
The first way is for determining overall Stock trend: if the pivot point is broken in an upward movement, then the stocks market is bullish, and vice versa. However, pivot levels are short term stock trend indicators, useful for only one day until they need to be recalculated.
The second method is to use these points to enter and exit the stocks markets. This stock indicator is a useful tool that can be used to calculate the areas that are likely to cause stock trading price movement.
These points should be used conjunction with other forms of technical analysis such as Moving averages, MACD & stochastic oscillator.
This stock indicator can be used in many different ways. Here are a few of the most common techniques for utilizing them.
Stock Trend Direction: Combined with other technical analysis techniques such as overbought/oversold oscillators, volatility measurements, the central point may be useful in determining the general trending direction of the market. Trades are only taken in direction of the Stock trend. Buy signal occurs only when the stocks market is above the central pivot and sell stock signal occur only when the stocks market is below the central pivot.
Stock Trading Price Breakouts: A bullish signal occurs when the stocks market breaks up through the central pivot or one of the resistances (typically Resistance 1). A bearish signal occurs when the stocks market breaks down through the central point or one of the supports (typically Support 1).
Stock Trend Reversals:
- A buy stock signal occurs when the stocks price moves towards a support level, gets very close to it, touches it, or moves only slightly through it, and then reverses and moves back in the opposite direction.
- A sell stock signal occurs when the stocks price moves towards a resistance level, gets very close to it, touches it, or moves only slightly through it, and then reverses and moves back in the opposite direction.
Stop Loss &/or Limit Profit Values Determined by Support/Resistance: This stock indicator might be potentially help-ful in determining suitable stoploss and/or limit profit placements. For example, if trading a long breakout above the Resistance 1 it may be reasonable to position a stoploss.
Combining with Moving Average Crossover System
A good indicator to combine and trade reversal stock trading signals is the moving average crossover which can be used to confirm the direction of a reversal stock trade signal.
An investor can then open an order once these two indicators give a signal in the same direction.
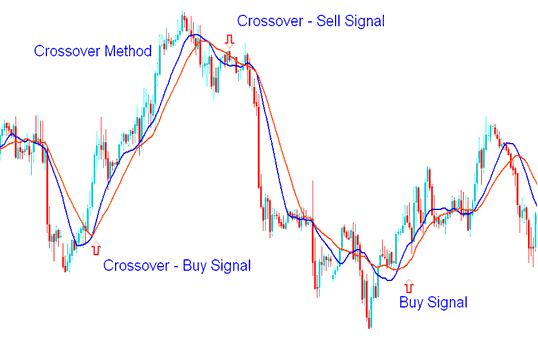
Moving Average Crossover Technique
Moving average crossover method that can be combined with this indicator to come up with a trading system for generating buy and sell stock trade signals.
To download Pivot points:
https://c.mql5.com/21/9/pro4x_pivot_lines.mq4
Once you download it open it with MQL4 Language Editor, Then Compile it by pressing the Compile Button Key and it will be added to your MT4.
NB: Once you add it to your MT4, trading indicator has additional lines named Mid Points, to remove these additional lines open the MQL4 Language Meta Editor(shortcut keyboard key - press F4), & change line 16 from:
Extern bool midpivots = true:
To
Extern bool midpivots = false:
Then Press Compile again, and it'll then appear as exactly shown on this website.


