Candlesticks Stock Chart Patterns
Stocks Trading Candlesticks Consolidation Pattern and Stocks Candles Continuation Pattern
Depending on the size & shape of a Stocks candlestick it is possible to determine the strength of buyers or sellers. Likewise it is also possible to determine underlying weakness of the buyers & sellers.
Long Body Stock Trading Candles
Candlesticks with long bodies show that there were a lot of buyers/sellers, depending on the color of the candlestick.
When stocks price makes a huge move from the opening stocks price to the closing stocks price it shows the strength of buyers/sellers.
Long Blue Candles - Strength of Buyers
Long Red Stock Candles - Strength of Sellers
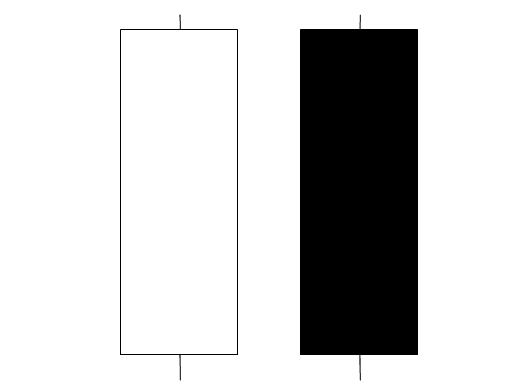
Long Body Candles
Short Body Candlesticks
Candlesticks with short bodies show that there were not so many buyers/sellers and the stocks price did not move much from the opening stocks price to the closing stock trading price.
These show that the buyers/sellers were not very strong.
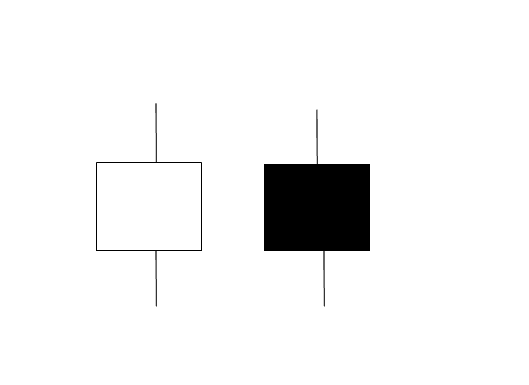
Short Body Candles
Marubozu Candlestick
Marubozu are long candles that have no upper or lower shadows, Like illustrated & shown below.
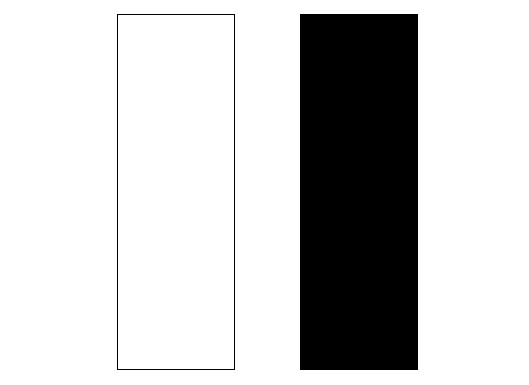
Marubozu Stock Trading Candles
Marubozu are continuing candlestick patterns which show stocks price is going to continue in same direction as that of the marubozu candle. The marubozu can be white/blue or Black/red depending on the direction of the trend.
Marubozu Stock Trading Candles
White marubozu - the open is also the low and the close is also the high.
Marubozu means there were no retracements during that stocks price period and therefore shows that buyers were in total control of the stock trading price.
White Marubozu is a continuation pattern meaning that the next candle is likely to continue in same upwards stock trend direction.
Black marubozu - the open is also the high and the close is also low.
Marubozu means there were no retracements and therefore shows that the sellers were in total control of the stock trading price.
Black Marubozu is a continuation pattern meaning that the next candlestick is likely to continue in same downwards stock trend direction.


