Placing Channels on Stocks Charts on the MT4 Software
The third option on the insert menu on the MT4 software is the channels button. The channels button key is used to insert various types of channels on Stock charts in MetaTrader 4 platform. Channels button is shown below.
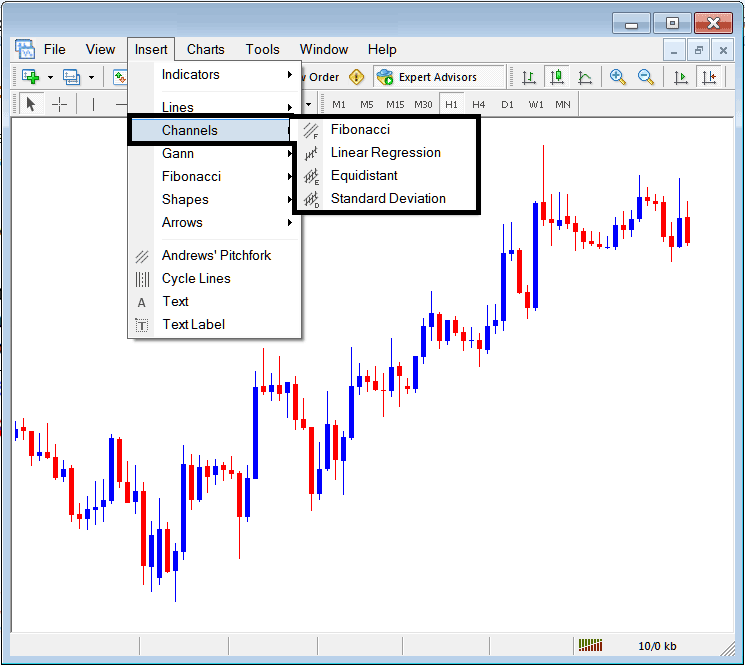
Menu Button For Placing Various Channel Tools on The MT4 Stock Trading Software
The channels that can be placed on the stocks charts are shown on the channels button menu are:
- Stock Trading Fibonacci Channels
- Linear Regression Channels
- Equidistant Channels
- Standard Deviation Channels
All these channels have different technical analysis and are drawn differently on MetaTrader 4 Stock charts.
Stock Trading Fibonacci Channels
Fibo Channels is a type of channel that's automatically drawn by this Fibo Channels button, To draw these Fibonacci channels, a trader selects two points where to draw the same way a stock trend line is drawn on the MT4 platform, once this stock trend points are joined, the Fibonacci channels drawing tool uses these points to draw the first stock trend line & then automatically draws another 5 lines that form channels - these channels are used as profit taking levels to book profits once the stocks price reaches these points.
Fibonacci levels used to plot these channels are: 0.618, 1.000, 1.618, 2.618, 4.236: The most commonly used channels are first two channels as illustrated & shown below:
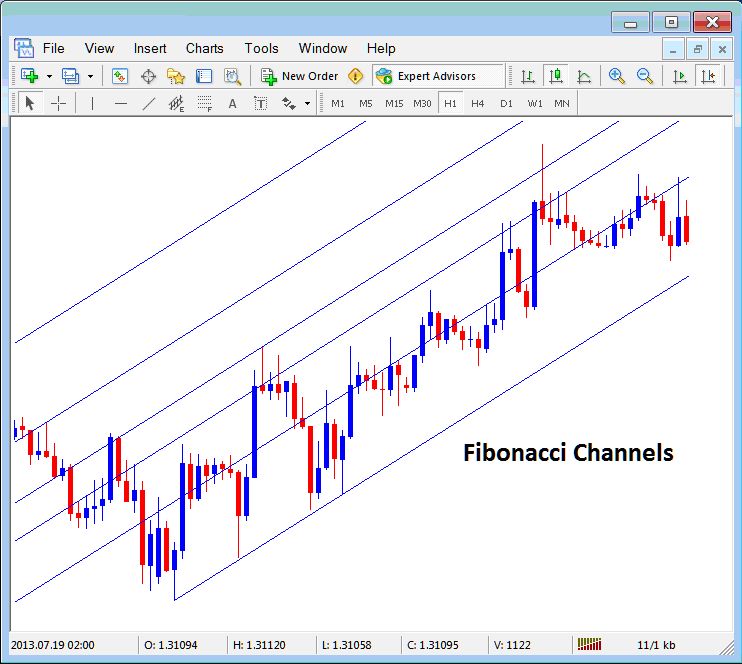
Placing Fibonacci Channels in MT4 Stock Charts
Linear Regression Channels
Linear regression channels are self adjusting channels, which adjusts as the channel is plotted from point 1 to point 2, linear regression channels then form what's similar to a stock price boundary, this stocks price boundary shows upper and lower stocks price boundary & the center point which is the mean for the stock price.
These upper and lower channels are used to open trades & close trades and also determine the levels to take profits or set stops for stocks trades. Linear regression channels are illustrated below:
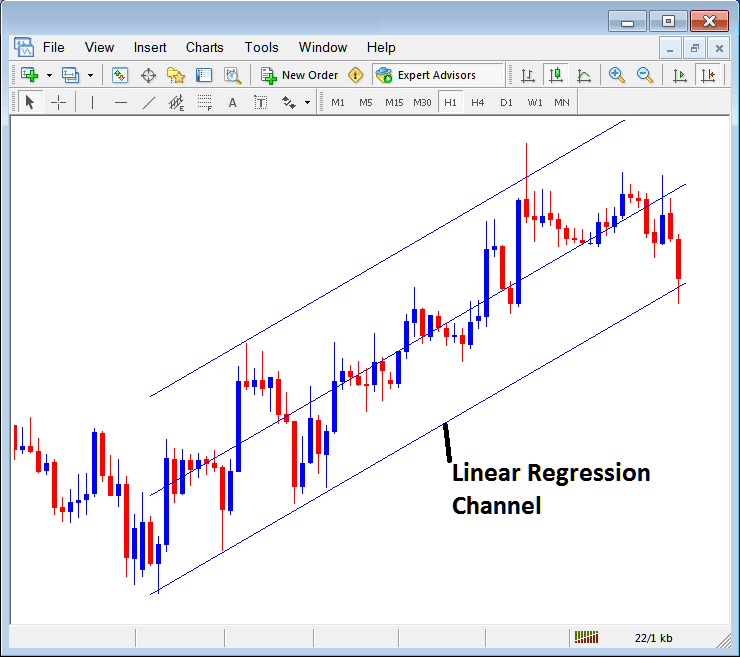
Placing Linear Regression Lines on MT4 Platform
Equidistant Channels
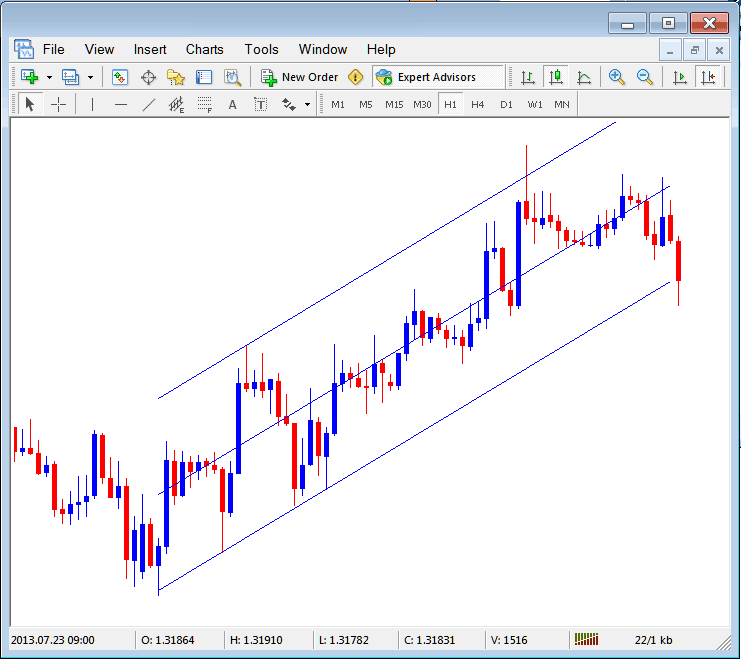
The equidistant channels is the most oftenly used channel in stock trading. On MT4 stocks platform, a trader can draw an upward channel or downward channel, the stocks trading example illustrated and explained below shows an upward Stocks channel, once the lower channel is drawn ( stock trend line), the top channel is automatically drawn, a trader can then double click the upper channel to adjust it so that it touches the highest high of stocks price as shown below - the next time stocks price touches this line the buy stock trade will then be closed and profit taken. As shown below this was the best stocks price to take profit when stocks price in the upward stock trend touched the upper channel.
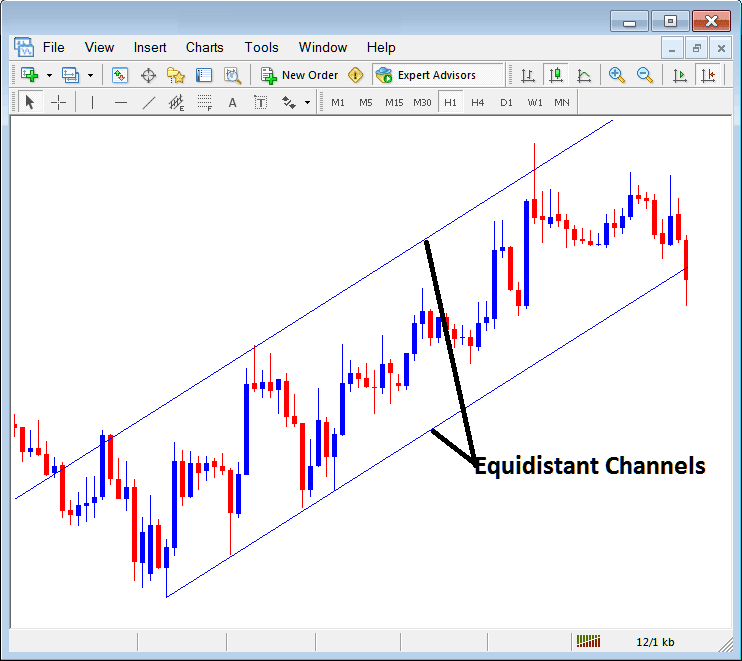
Placing Equidistant Channels on MT4 Platform
Standard Deviation Channels
Standard Deviation channel is similar to Linear Regression channel and it is also used to set the upper & lower boundaries within which stocks price should move within. The Standard Deviation channel is displayed and shown below.
Placing Standard Deviation Channels on MT4 Platform


