Place Bollinger Bands Stock Technical Indicator on Stocks Chart on MetaTrader 4 Software
This Tutorial will explain how to place the Bollinger Bands Stock Technical Indicator on Stocks Chart in the MT4 Platform. For technical analysis: Technical Analysis of Bollinger Bands.
How to Place Stock Technical Indicators in MetaTrader 4 Stock Charts
Step 1: Open The Software Navigator Window Panel
Open Navigator window panel as illustrated and shown below - Navigate to ' View ' menu (then click) and then choose ' Navigator ' window panel (click), or From Standard Tool Bar click the 'Navigator' button or press the key-board short-cut key 'Ctrl+N'
On the Navigator window panel, select 'Indicators' , (DoubleClick)
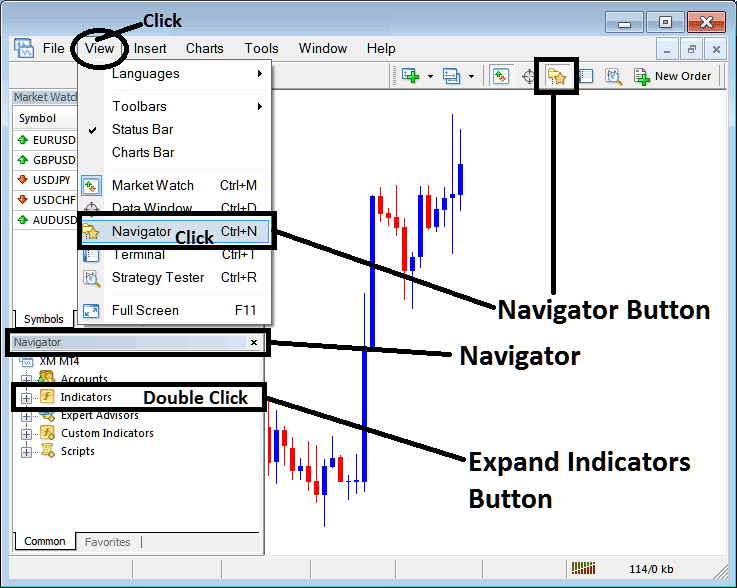
Step 2: Expand the Stocks Trading Indicator Menu on the Navigator
Expand the indicator menu by clicking on expand button key mark (+) or double click the 'indicators' menu, after this the button key will appear as (-) and will now display as a list as illustrated and shown below.
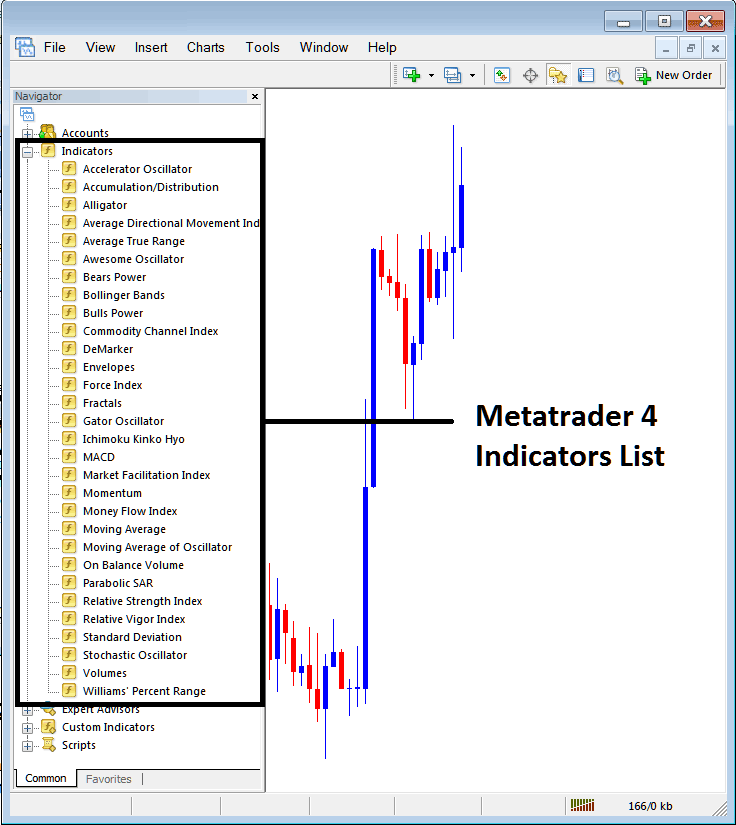
From Above window panel you can then add any technical indicator you want on the stock chart.
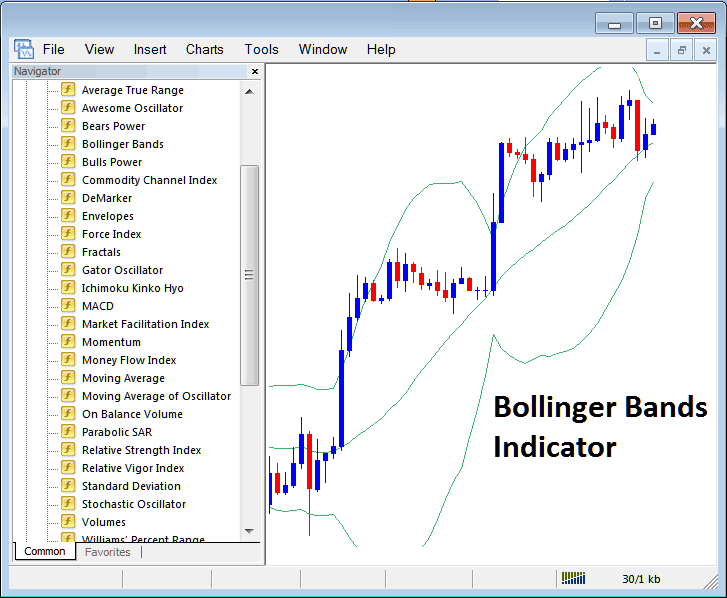
Placing Bollinger Bands
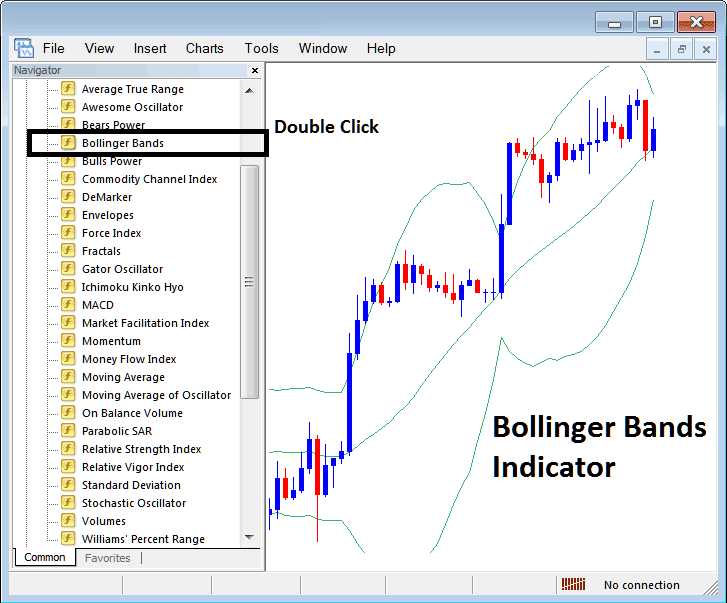
Step 1: Choose the Bollinger Bands button on the MT4 list of technical indicators as displayed below:

Step 2: Double-click the Bollinger Bands Button, & click okay to place the technical indicator on the chart as displayed below:
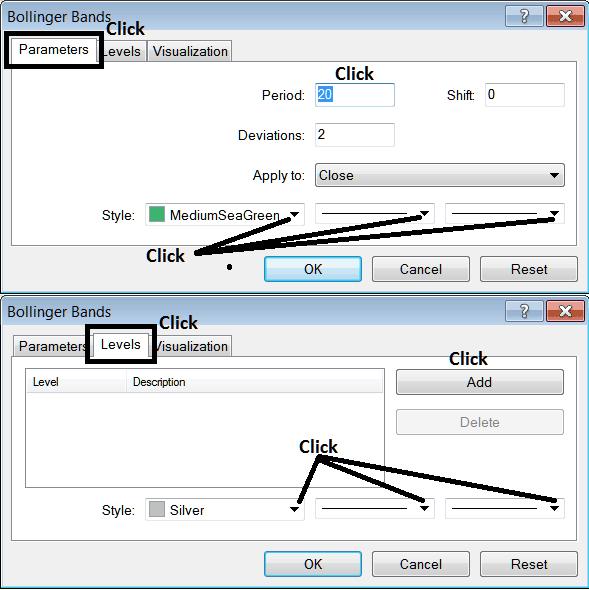
Edit Stock Trading Indicator Setting
To Adjust and Change Settings, right click on the Bollinger Bands, select properties settings & then edit the properties using the pop up menu which appears and then click ok button key after you change settings.
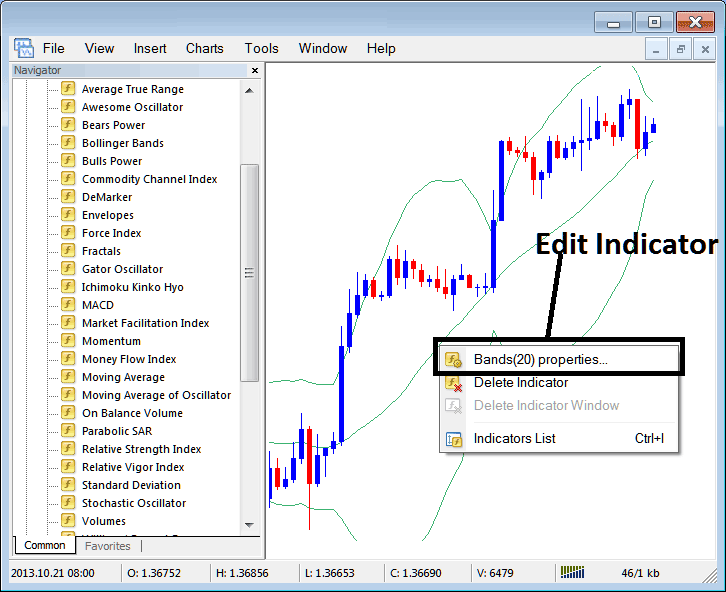
The following popup panel pops up & Bollinger Bands settings can be edited from this pop up panel.