Place Parabolic SAR Stock Indicator on Stocks Chart on MetaTrader 4 Software
This learn stock trading tutorial will explain how to place the Parabolic SAR, (Stop And Reverse), on the Stock Chart on the MT4 platform. For Technical analysis: Technical analysis of stock trading Parabolic SAR.

How to Place Stocks Indicators in MT4 Stocks Charts
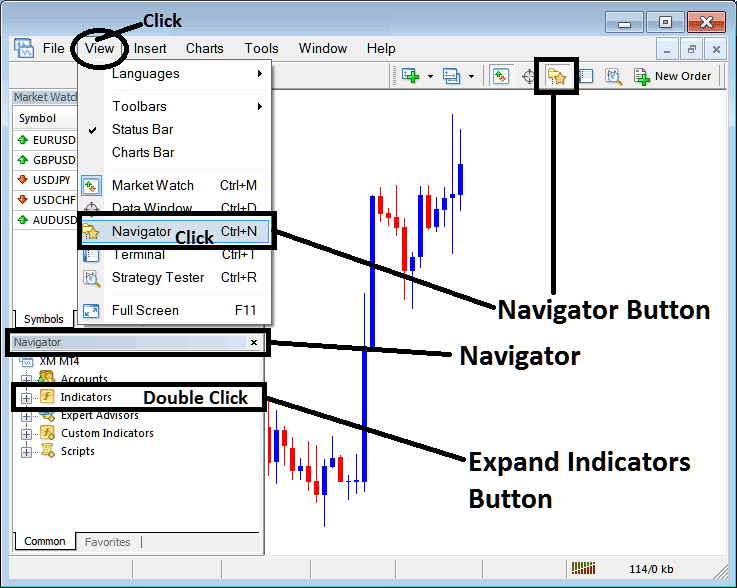
Step 1: Open The Platform Navigator Panel
Open Navigator window panel as illustrated and shown below - Navigate to ' View ' menu (then click) and then choose ' Navigator ' window panel (click), or From Standard Tool Bar click the 'Navigator' button or press the key-board short-cut key 'Ctrl+N'
On the Navigator window panel, select 'Indicators' , (DoubleClick)
Step 2: Expand the Stock Technical Indicator Menu on the Navigator
Expand the menu by clicking on expand button marker (+) or double click the 'indicators' menu, after that, this button key will then appear as (-) and will now be displayed as a list as illustrated and shown below.
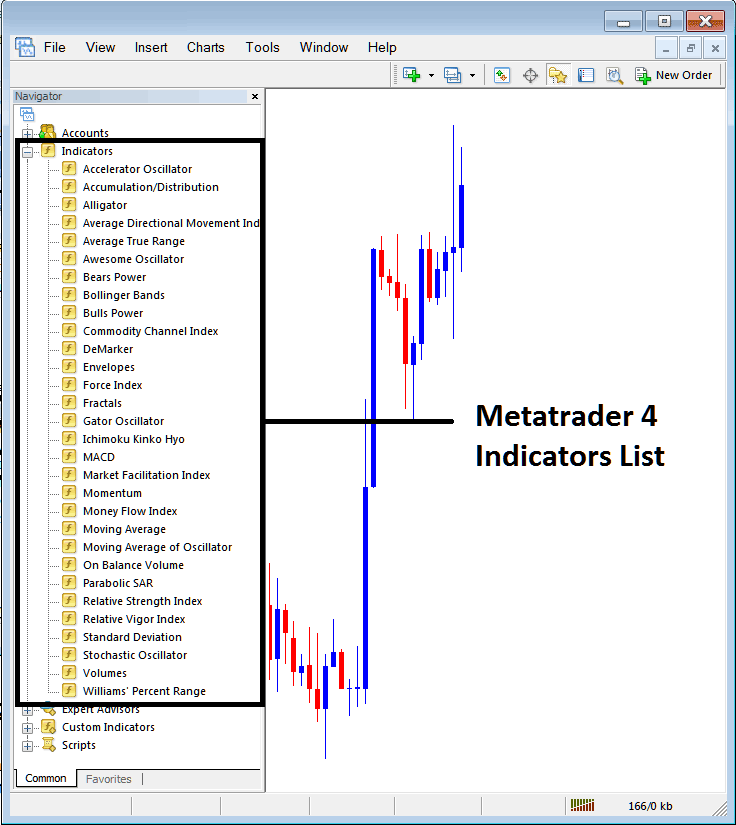
From Above window panel you can then add any technical indicator you want on the Stock chart.
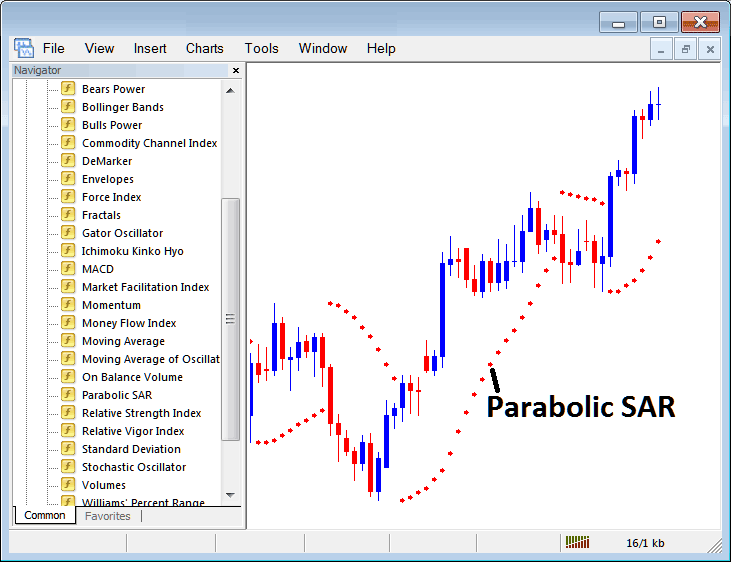
Placing Parabolic SAR on a Stock Trading Chart
Step 1: Choose the Parabolic SAR button key on MT4 list of technical indicators as shown below:
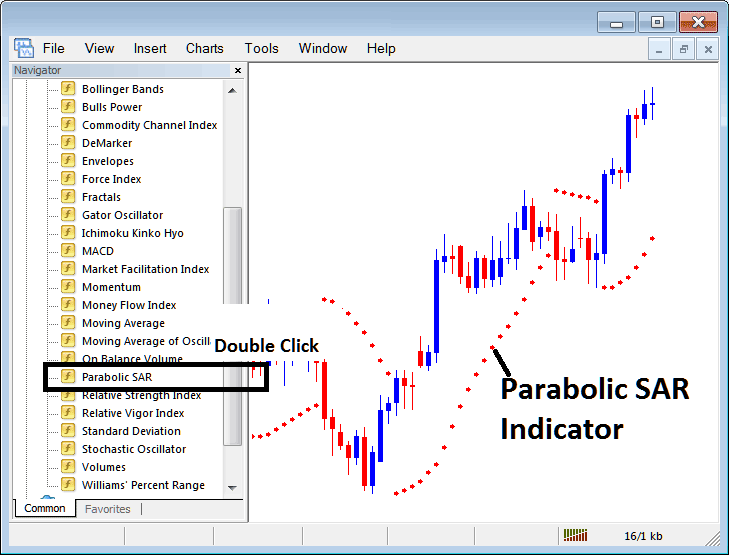
Step 2: Doubleclick the Parabolic SAR Button Key, & click okay to place the indicator on the chart as displayed below:
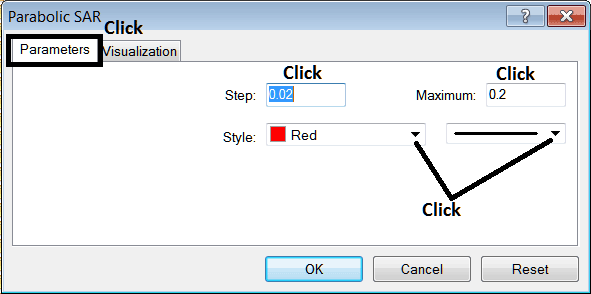
Edit Parabolic SAR Stocks Indicator Settings
To Adjust the Settings, right click in the Parabolic SAR Stock Indicator, select properties setting and then edit the properties using the popup menu that appears and then click okay button after you change settings.
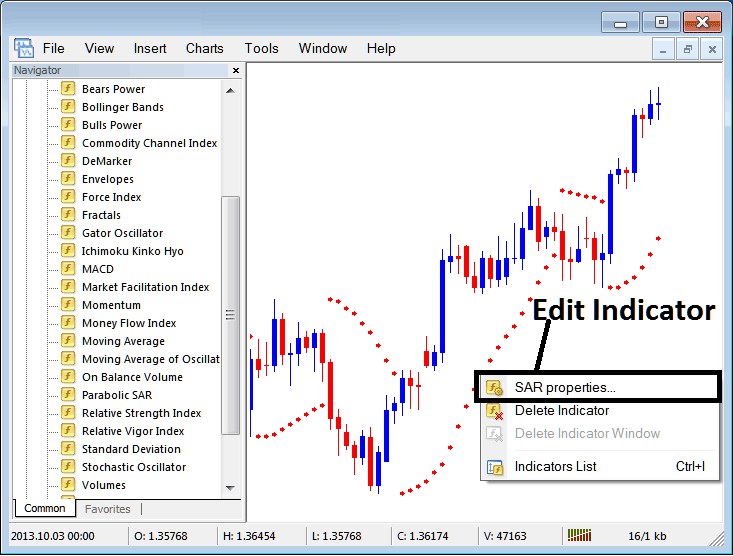
The following popup window appears & Technical Indicator settings can be edited from this pop up.