Fibonacci Ratios Stock Analysis & Trading Signals
Derived from the original Bollinger bands.
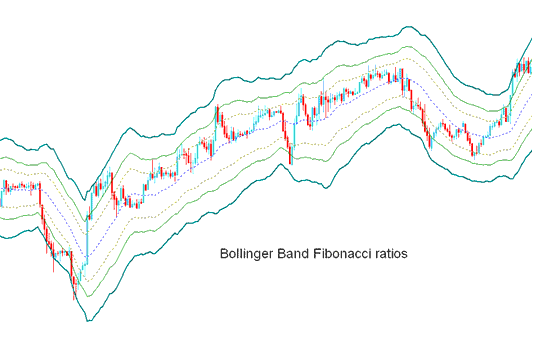
The Bollinger Fib ratios is a volatility based indicators but it does not use the standard deviation to calculate the width of the bands instead it uses a smoothed ATR that are multiplied with Fibonacci ratios of 1.618, 2.618, and 4.236.
The smoothed lines that are multiplied with Fibo ratios are then added or subtracted from the moving average.
This forms Three upper Fibonacci bands & 3 lower Fibonacci bands
Middle band forms the basis of the market trend.
Stocks Trading Analysis & Generating Trading Signals
This stock indicator used to determine point of support and resistance for stock.
The lines below represent support points while those above are resistance zones.
Outermost bands provide the strongest resistance/support.
The inner most bands provide least support/resistance.
The innermost band represents Fibonacci 38.20% retracement level
The second band represents Fib 50% retracement level
The outermost band represents Fib 61.8% retracement level
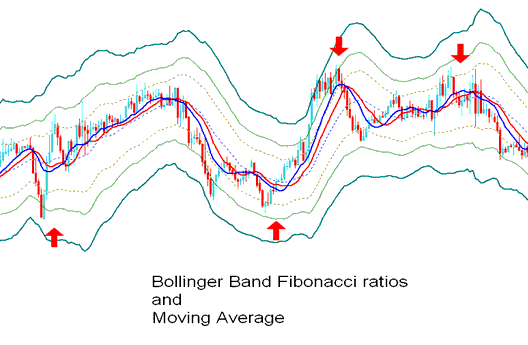
The indicator is used to determine points where stocks price might reverse. (Stock Price Pullback Levels)
When stocks price hits one of the lines & reverses then an entry or exit trading signal is generated.
However, it is always good to combine the signal with other confirmation indicators such as the moving average to confirm the signal as displayed below.
Technical Analysis in Stocks Trading


