Moving Average Stocks Analysis & Moving Average Trading Signals
An technical indicator that calculates the average value of stocks prices ( or any specified price data sequence ) over a pre-determined period of time.
The only significant difference between various types of MAs is weight assigned to most recent data. Simple moving averages apply equal weight to the stock prices. Exponential & weighted averages apply more weight to recent stock prices.
Interpretation
The most popular method of analyzing the Moving Average is to compare the relationship between the Moving Average of the stocks price with the stocks price itself. A buy stock signal is generated when the stocks price rises above its Moving Average and a sell stock signal is generated when the stocks price falls below its Moving Average.
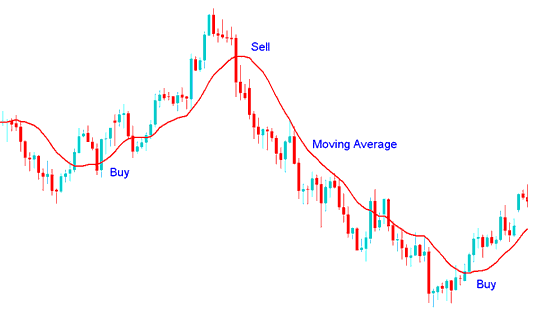
MA Technical Indicator
Buy & Sell Stock Trading Signals generated by Moving Average crossing above or below stock trading price action.
Moving Average Crossover Stocks Trading Strategies
Also popular are various types of moving average cross over systems. Such systems often include two or more moving averages crossing above/below each other & perhaps even utilizing other technical indicators as additional entry and exit confirmation trading signals. Combinations of conditions for these types of trading systems are almost limitless.
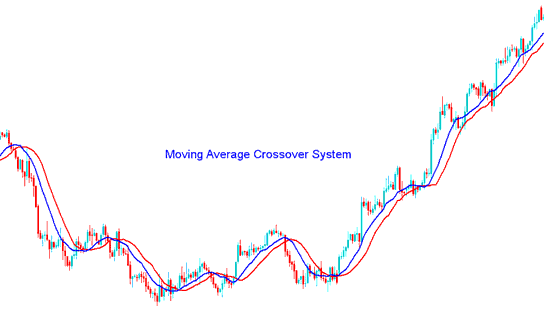
Moving Average Crossover System


