Getting Started With MT4 Stock Trading Software
The following guides explain how to use the MT4 stocks trading software, each lesson is accompanied by numerous screen shots so as to help traders to understand concepts explained & make it easier to learn about this online stock trading platform.
Introduction
File
- Opening a Practice Account Procedure
- Open a Stock Chart
- Opening Offline Chart
- Opening a Deleted Chart
- Saving a Profile
- Login to an Account
- Printing Stock Charts
View
- Changing Language
- Tool Bars
- Connection Bars
- Charts Bar
- Market Watch
- Data Window
- Navigator
- MetaTrader 4 Terminal Window
- Stock Trading Strategy Tester
Insert
- Indicators Insert Menu
- Insert Line Studies
- Placing Channels
- Gann Lines
- Placing Fibonacci Lines
- Insert Shapes
- Placing Arrows
- Insert Andrew's Pitchfork, Cycle Lines, Text Label
Charts
- Indicators List
- Objects List
- Bar Stock Chart
- Line Stock Chart
- Candlesticks
- Time frames - Periodicity
- Saving a Template
- Grid, Volumes, Auto Scroll and Shift
- Zoom in, Zoom Out & Stock Trading Step by Step
- Setting Properties
Tools
- Place New Order
- History Center on Tools Menu
- Options Settings
- MetaEditor Custom Indicators
- MetaEditor Expert Advisors
Window Menu
Help Menu
Toolbars
Advanced Topics
- MQL5 Signals - Copy Top MT4 Traders
- Advantages MQL5 Signals
- Signal Seller Advantages
- MQL5 Stock Trading Expert Advisors
How to Place Stock Technical Indicators
- Accelerator Oscillator
- Accumulation Distribution
- Alligator
- ADX
- Average True Range Technical Indicator
- Awesome Oscillator
- Bears Power
- Bollinger Bands Technical Indicator
- Bulls Power
- Commodity Channel Index
- Demarker
- Force Index
- Fractals
- Gator Oscillator
- Heiken Ashi
- Ichimoku
- MACD
- Market Facilitation Index
- Momentum
- Money Flow Index
- Moving Average Envelopes
- Moving Average Technical Indicator
- Moving Average Oscillator
- On Balance Volume
- Parabolic SAR
- RSI
- Relative Vigor Index
- Standard Deviation
- Stochastic Oscillator Technical Indicator
- Volumes
- Williams Percentage Range
- Zigzag
The MT4 is part of the online stock market. The MT4 software is installed on a client's computer.
The screen-shot below shows the user inter-face of MetaTrader 4.
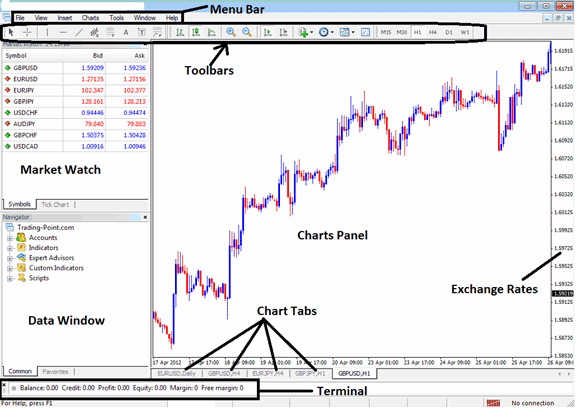
MetaTrader 4 stocks software Workspace
According to stock trading platforms reviews, MT4 is the most widely used stock platform. This is because it's easy to learn & can do the following tasks.
The MT4 software is installed on a stock trader's PC computer & it is intended to do the following:
- Plot graphical Data about exchange rates in form of a grid/trading chart
- Receive streaming exchange quotes from the stock brokers
- Perform stock trading transaction operations: buying & selling
- Show the open stock trading transactions and orders within the stock trading platform workspace
- Perform technical analysis
- Testing of strategies on practice practice stocks trading accounts
- Coding of custom indicators and Expert Advisors for the purpose of automated stock trading.
- Provide statements of transaction history & a summary of profits/losses.
This is a free stock platform which is provided for by online stock brokers. You can download the platform from online brokers web sites, once you download it, you should then setup & setup the platform on a Desktop PC computer which has an inter net connectivity & then connect to your stocks broker & start receiving streaming quotes.
The MetaTrader 4 online stock trading platform which is also known as MT4, is designed to provide technical tools that can be used by Stock traders to make buy or sell decisions. This stock platform provides online exchange quotes and streaming data about stocks price movement drawn in the form of stock price charts. This information is delivered directly to the MT4 stocks software interface. This information that is delivered in the form of realtime quotes is then interpreted using technical tools that are provided within this online trading platform.
The MT4 has different window & chart panels, each designed to deliver a different type of market data, starting with the exchange rate quotes used to draw stock trading graphs to the stocks market data panel, toolbars for attaching technical indicators and the main menu bar used to navigate the platform.


